
Height Noise


I understand that many people fall in love with Perlin noise when they first learn about it. It did win an Oscar, after all. But why use a simulation of reality, when you can just use reality instead?
Let's back up for a moment. Perlin noise, if you've never come across it before, is a set of random-ish numbers generated by an algorithm that look more "natural" than truly random numbers. You know the static you see on a TV screen when it's not tuned to a channel? That's true randomness, also known as white noise. Perlin noise looks cloudier, blobbier, instead.
It's created by allowing a number to be influenced by those surrounding it. If you've got a five in one grid space, then it's more likely that the numbers before and surrounding it would be six or four, and less likely that they'd be two or nine. As a result you get nice, natural-looking curves. Curves like my Mountain Drive sketch.
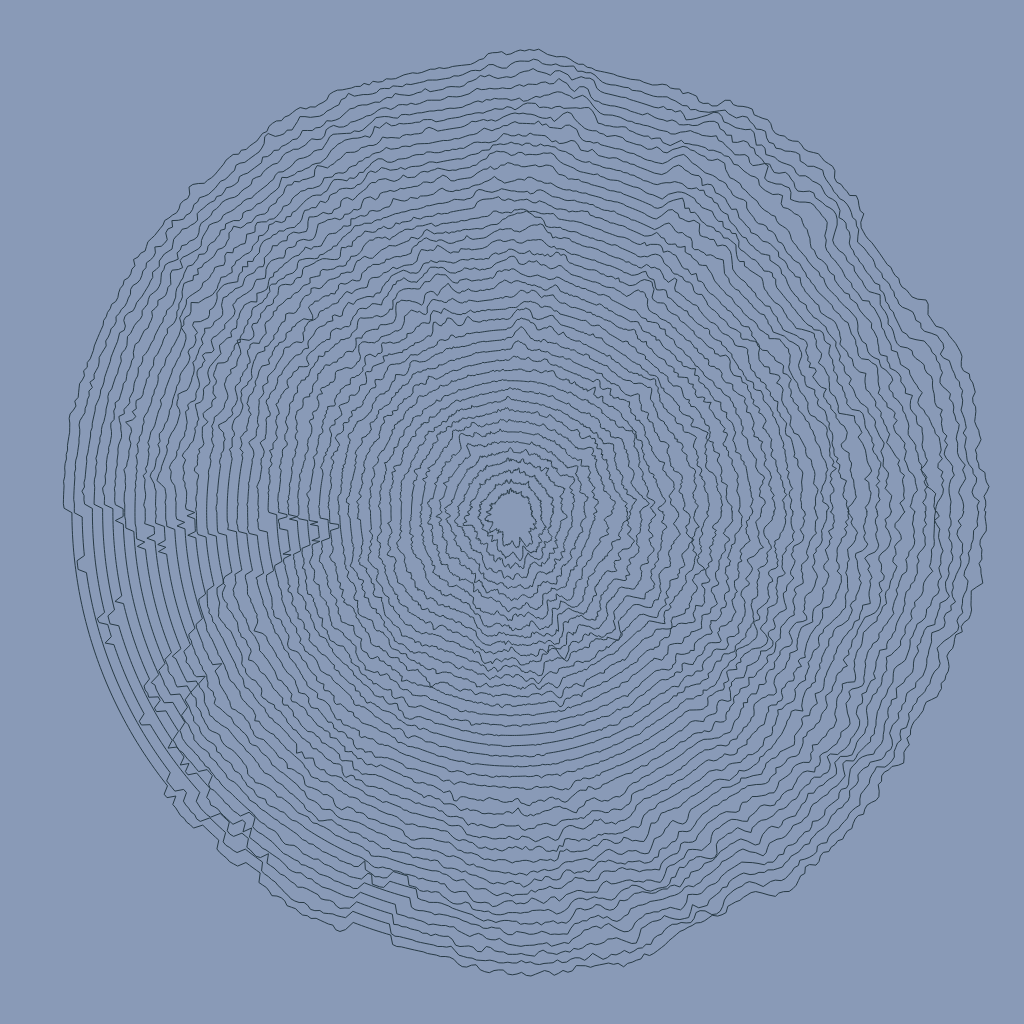
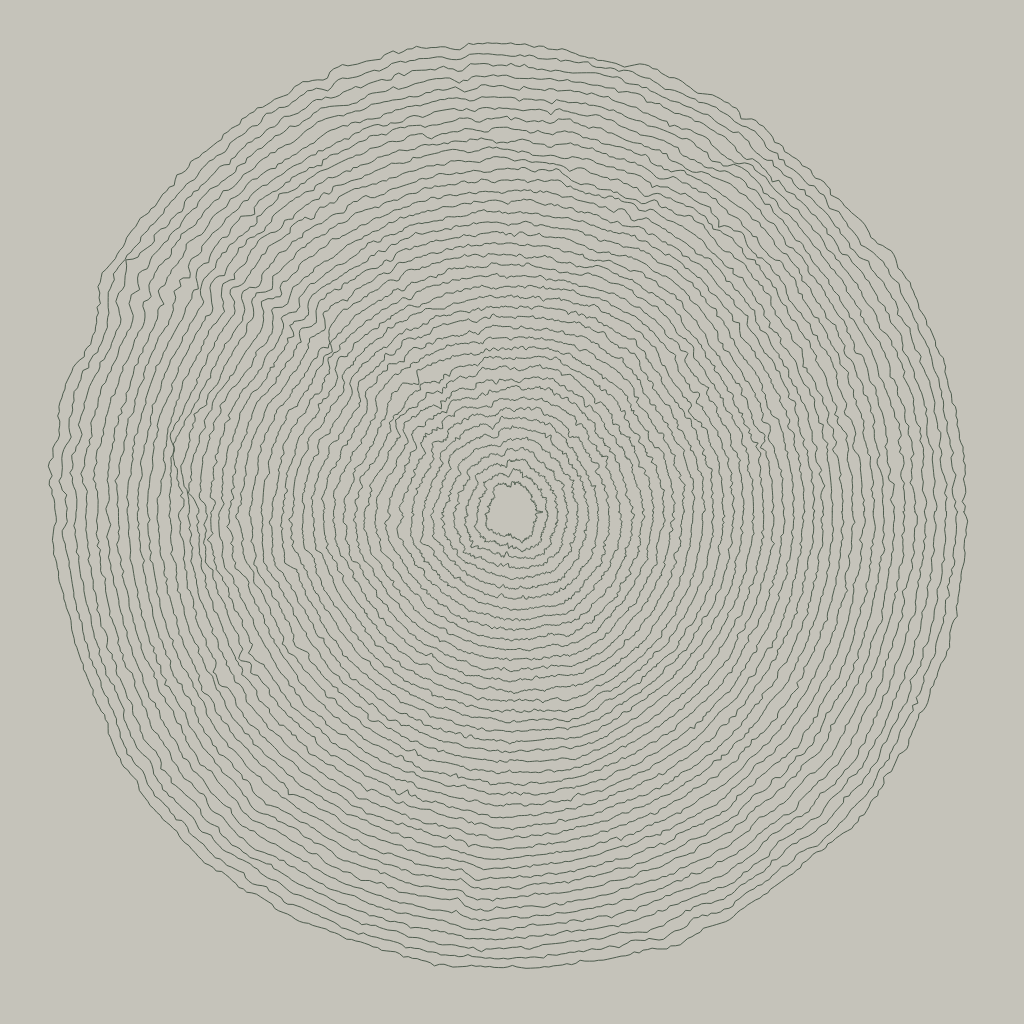
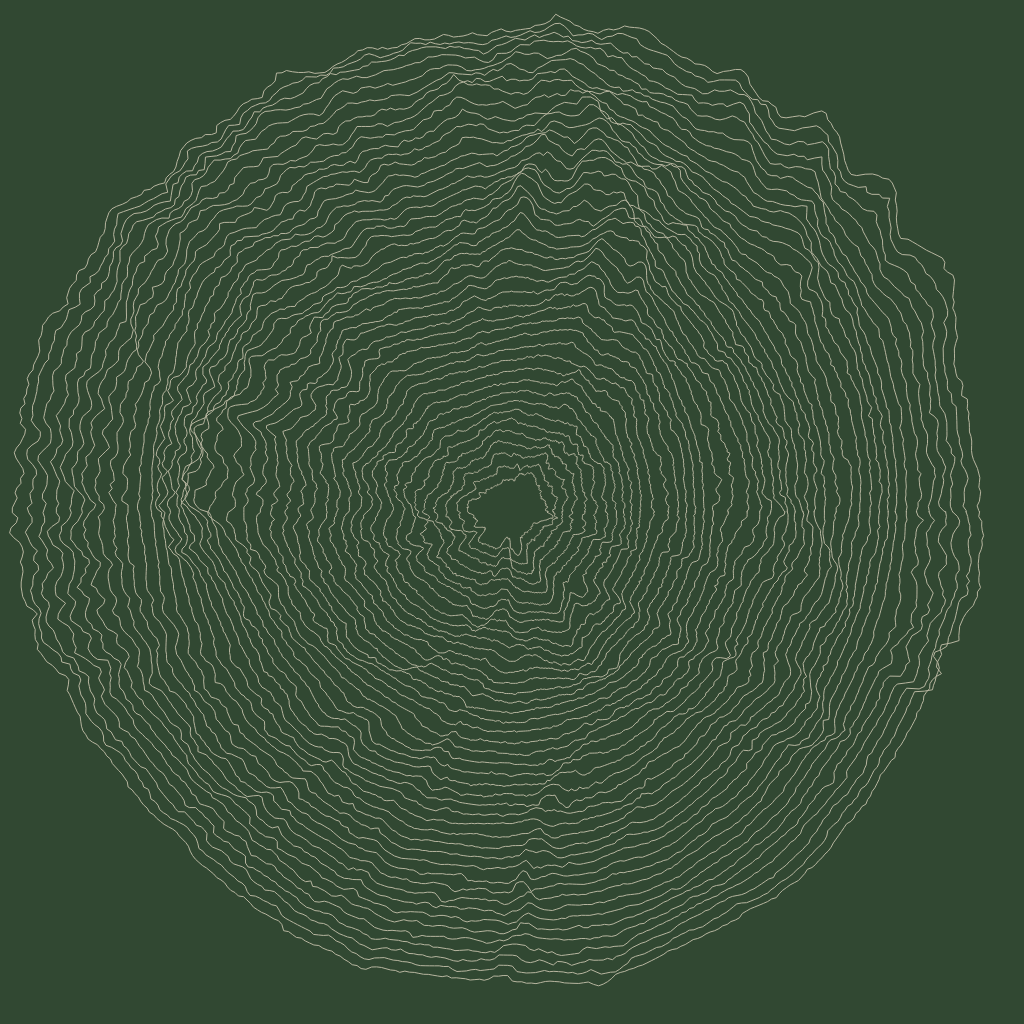
But why simulate mountains in code, when you could USE the shape of real mountains in your code instead? That's what I did in the following three sketches, taking heightmap data from terrain.party and using it to peturb the outlines of circles. The result is pretty nice, I think - subtle but interesting. You can see natural shapes, but they don't dominate.
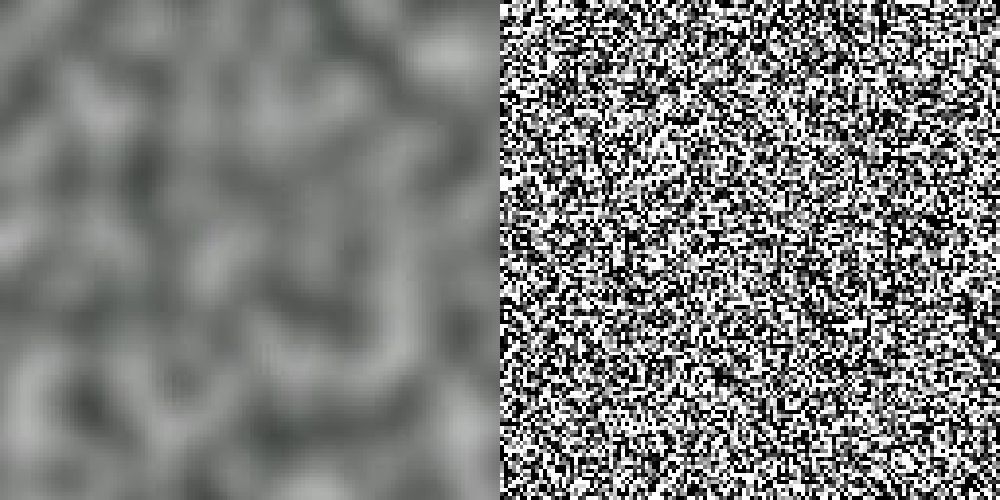
Here are the heightmaps that they were generated from.
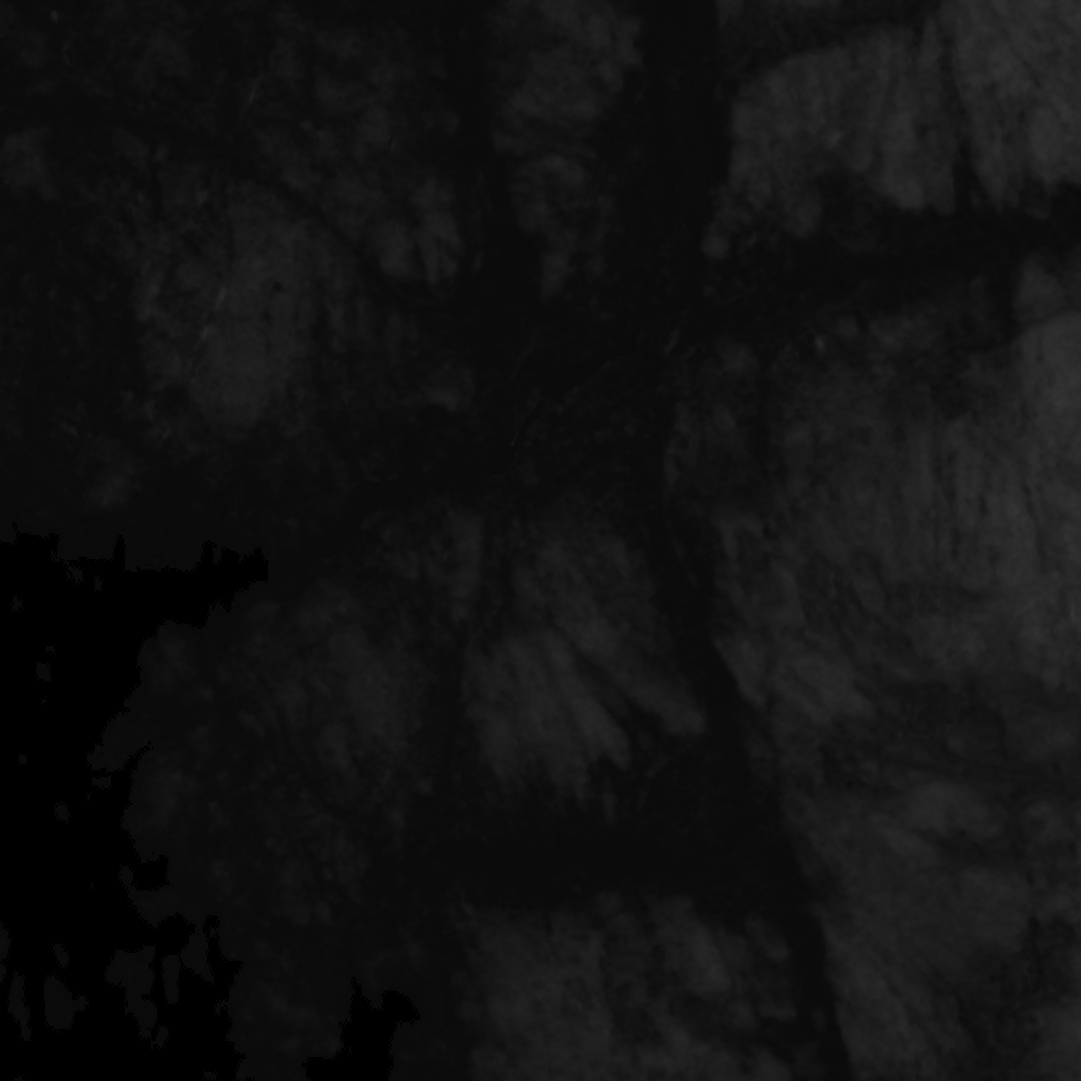
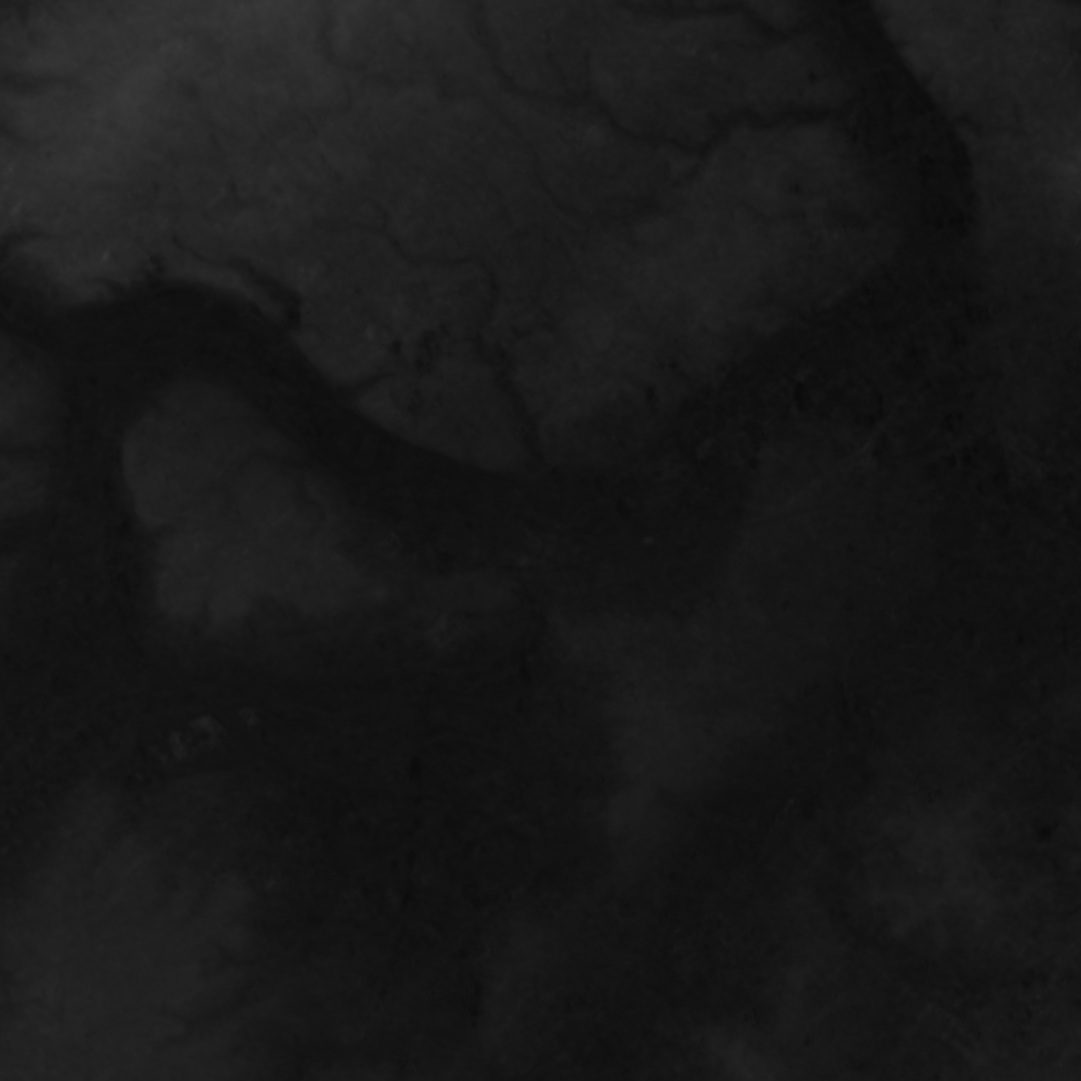
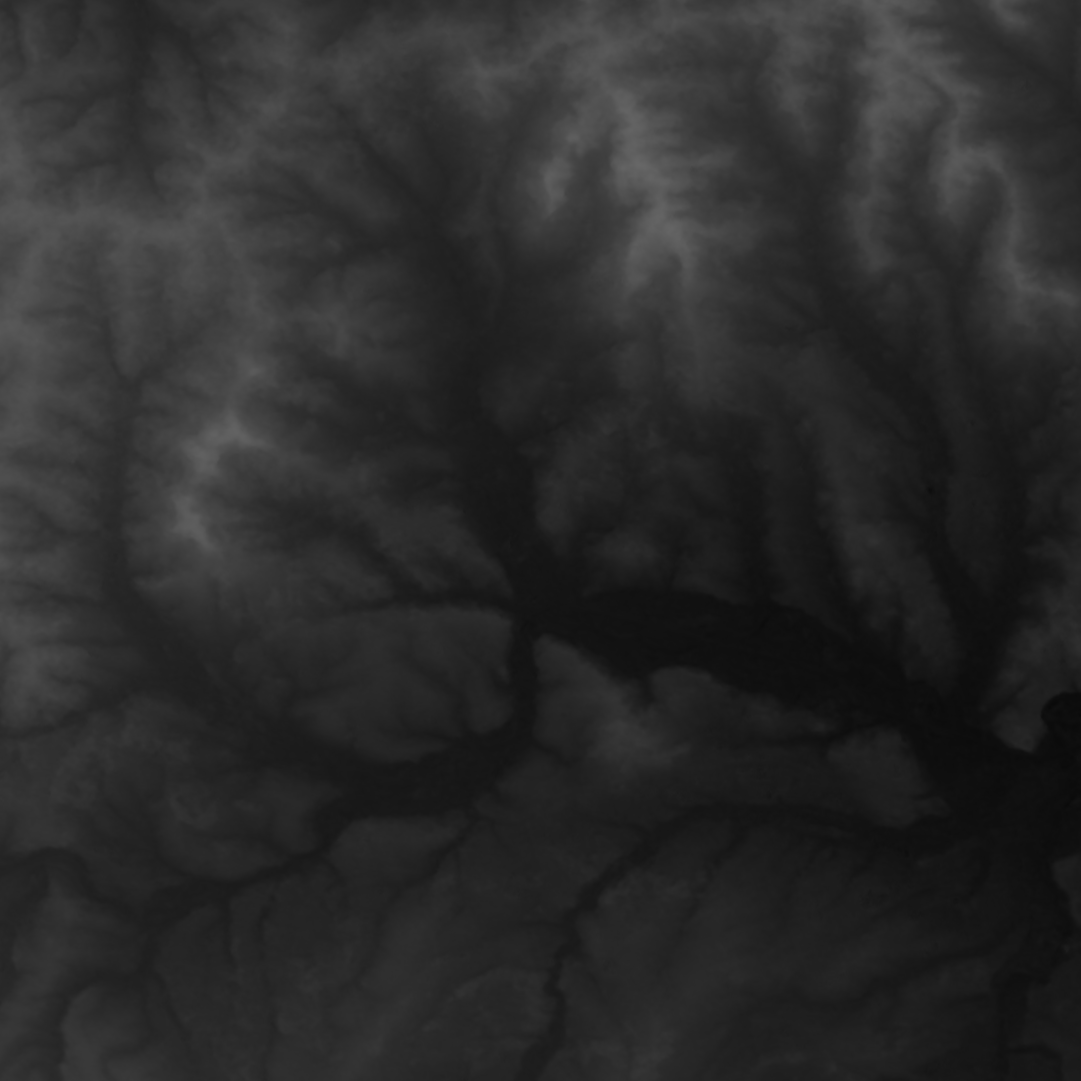
In slightly more detail, here's what I did. First I pulled in the image, then I took the brightness data for each pixel. Then I draw an imaginary circle over that image and stored the numbers along the edge of that circle in an array. I repeated that for larger and larger circles until I reached the edge of the image. Then I drew circles on my canvas, and for each point along the outline of the circle I moved it inward if the corresponding image pixel was darker (lower) than average, and outward if it was lighter (higher) than average.
You can grab the code here if you want to play with it - it uses the P5.js library:
// Initialise constants and variables
const centre = 10;
const scaleFactor = 200;
const angleStep = 0.01;
const lines = 50;
const margin = 70;
const step = (width/2)/lines;

let imgNoise;

// Set style parameters
noFill()
stroke("#4E5C4E")
background("#C5C3BA")

// Return a renderer to 'draw' the p5.js content
return ({width, height }) => {

	const img = loadImage('data/heightmap-rdg.png', img => {
		console.log(img);

		// Move to centre of canvas
		translate(width/2,height/2);

		// Loop over all the circles
		for (let level = 0; level < width/2 - centre - margin; level += step) {

			// Reset the imgNoise array
			imgNoise = []

			// Grab the brightness level at the right spots
			for (let a = 0; a < TWO_PI; a += angleStep) {
				let r = centre + level + scaleFactor/2;
				let x = (cos(a) * r) + img.width/2;
				let y = (sin(a) * r) + img.height/2;
				let c = color(img.get(x,y));
				let bright = (red(c) + green(c) + blue(c)) / 3;
				let theNoise = map(bright,0,255,0,1)
				imgNoise.push(theNoise)
			}

			console.log(imgNoise)

			// Plot circle
			beginShape();
			for (let i = 0; i < imgNoise.length; i++) {
				let a = i * angleStep;
				let r = centre + level + (imgNoise[i] * scaleFactor);
				let x = cos(a) * r;
				let y = sin(a) * r;

				vertex(x,y)
			}
			endShape(CLOSE)
		}

	});
};
The colours were chosen by taking satellite images of the same areas and putting them through a palette-from-image tool.
Height is just one of many variables I could play with, of course. There are all kinds of things that are collected in a gridded fashion and are free and relatively easy to access - altitude, temperature, wind speeds, rainfall, and much more. The Open Data Cube, perhaps.
I'm working on plotting these, but to get there I'll need to convert my code from p5.js to something like Rune.js which can output an SVG. Look out for that soon.