From the Archive: Structure de Quadrilatéres


Back in May 2018, I attended OpenVisConf in Paris, and I took the opportunity to visit the "Artistes et Robots" exhibition at the Grand Palais. I saw a pen plotter artwork artwork by Vera Molnár there that really struck me, titled Structure de Quadrilatéres. This, interestingly, was long before I got interested in making pen plotter artwork myself.
Anyway, I wanted to improve my Javascript skills so I built a recreation of the artwork in an Observable notebook, using D3.js. The result is pretty good, I think.
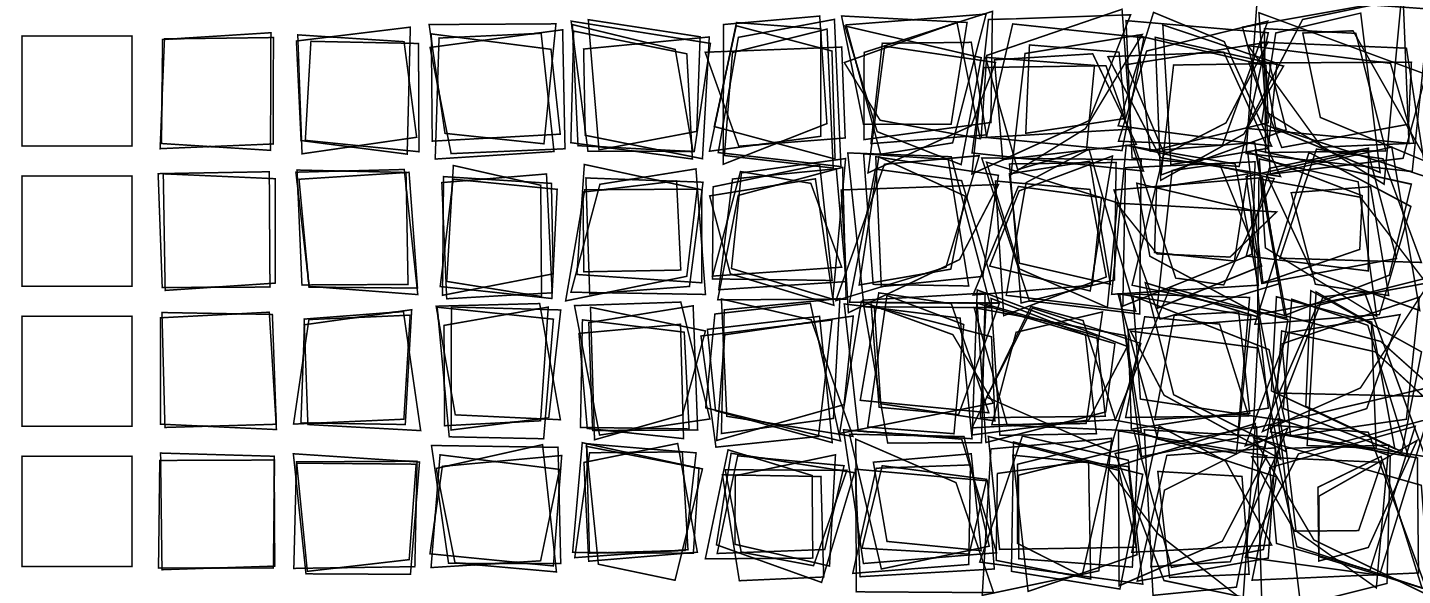
More importantly, though, Observable's notebook format lets you read through my coding thought process - building it up from a single square to something that's interactive, generative and animated. I think it's a great way of teaching code and understanding someone else's work.
Check it out here:
 Duncan Geere
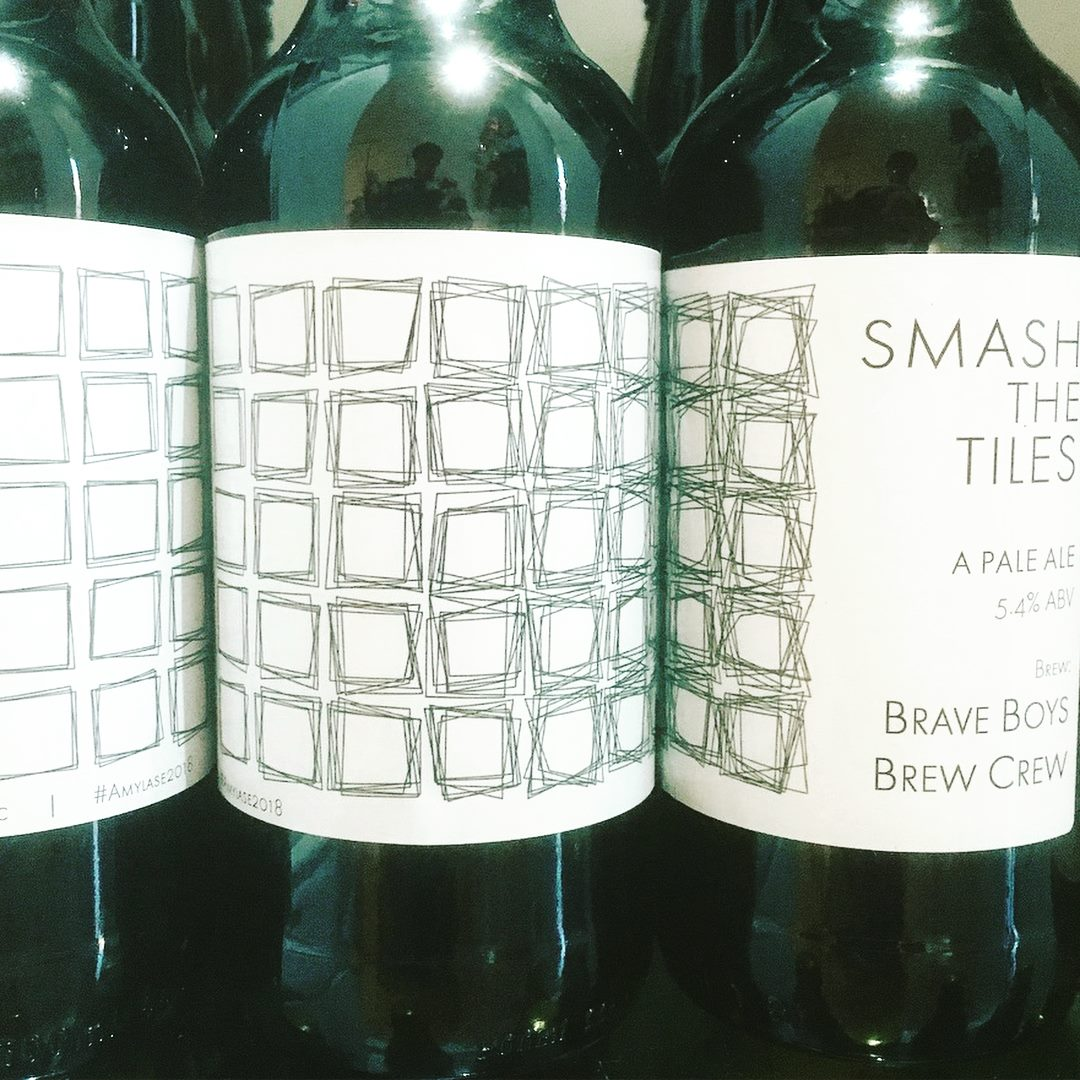
Subsequently, some friends of mine at Craft Labs here in Gothenburg asked if they could use my Quadrilatéres on the label of a beer they’d brewed. The results looked pretty good: