A Weekend With a Plotter

It was pretty good timing that my plotter arrived just before the Easter weekend. I had a full four days to experiment with it and start to get to grips with how it works. Here are my experiences.
Unboxing and Setup
I ordered my Axidraw V3/A3 from Robotshop.eu, and delivery was fast and not too expensive. Setup is similarly quick and easy, and documented well in the user guide. You can go from opening to box to finishing your first plot in less than ten minutes, I'd say.
My partner Silfa and I took care while unboxing it to document the process as best we could, with the goal of starting a YouTube channel on the subject - there doesn't appear to be a lot of plotter work on YouTube, at least that I could find. We documented the whole unboxing and setup experience in the following video.
The only slight setup difficulty was that the Axidraw is normally driven by a bunch of Inkscape extensions, and at the time of writing OS X Catalina isn't compatible with the release builds of Inkscape, only a new beta version (and not a super-stable beta, at that).
To get the version of the extensions that work with that that beta version, you need to email Axidraw customer support. If you're in Catalina-land, I'd advise doing this before your plotter arrives so you don't have have to sit there watching it while you want for someone to reply to your email.
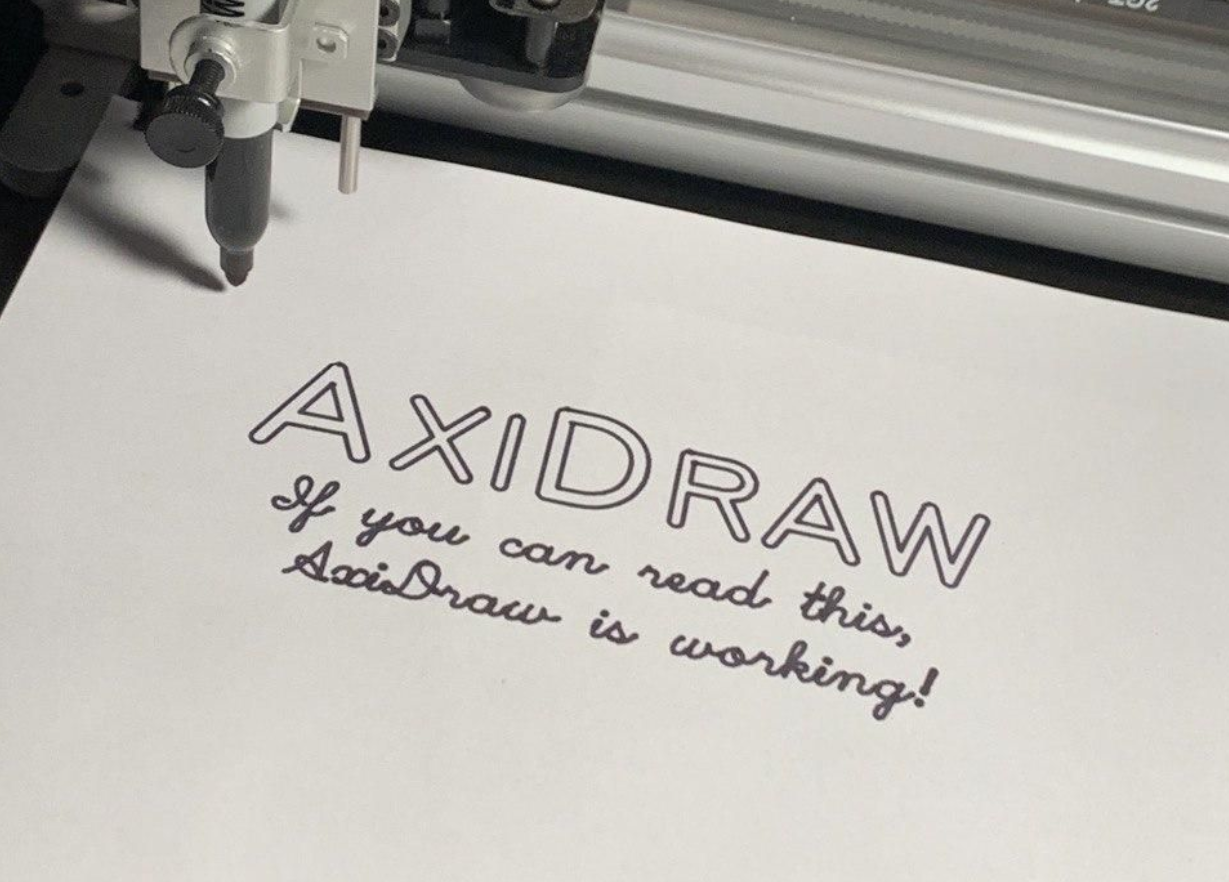
First Plots
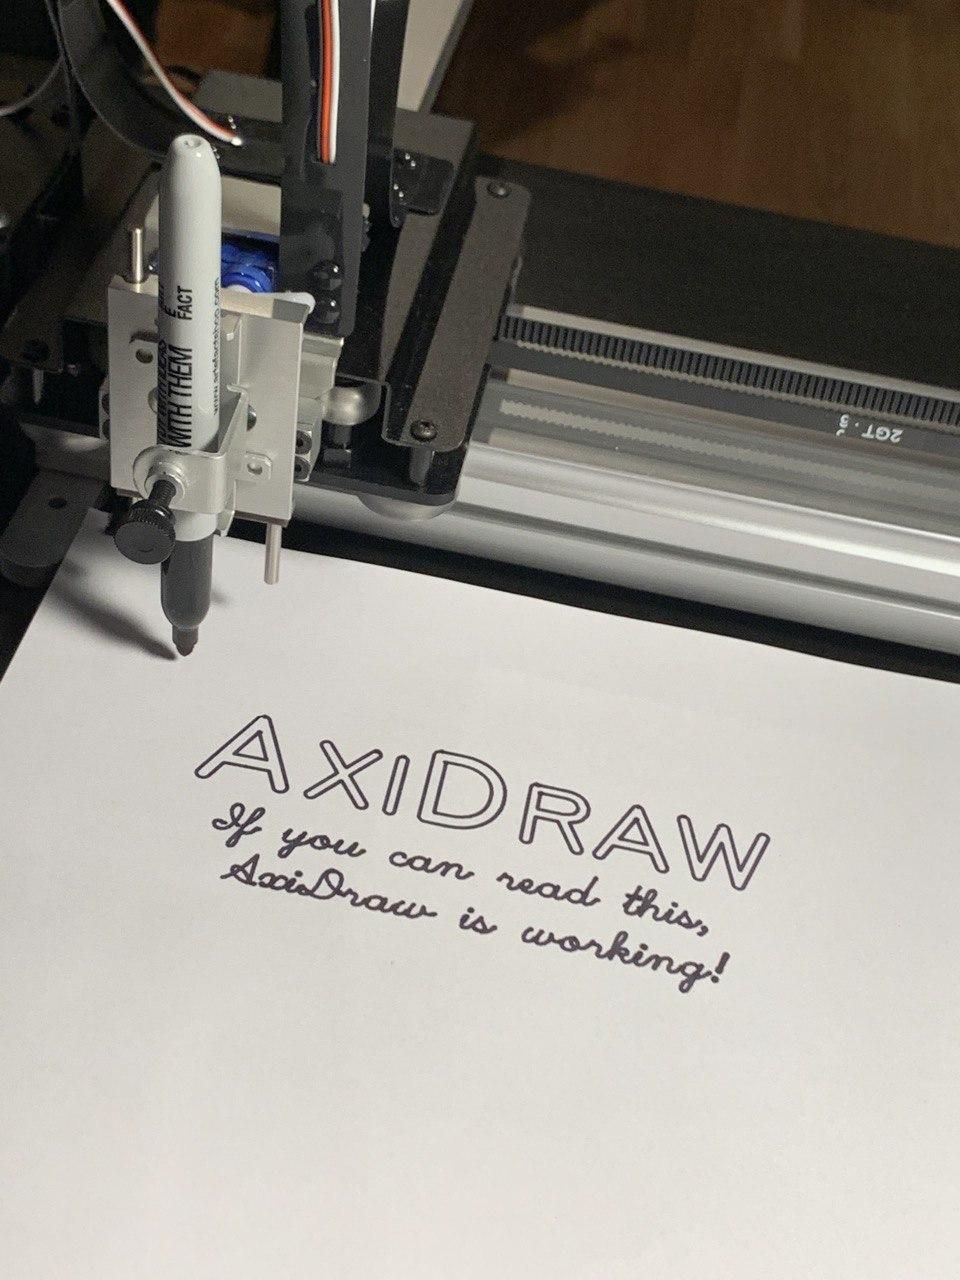
To start with, we mostly plotted sample files included with the Axidraw itself. This was super easy - usually just opening a file in Inkscape, opening the Axidraw extension, and hitting "plot". Here are a few of our earliest plots:
I recorded a few timelapse, but I don't have a good solution for embedding these here, just now. If you have any recommendations for a better gif-style video hosting solution for Ghost, then I'd love to hear about it. In the meantime, here's a Twitter embed:
I bought a pen plotter! An Axidraw V3/A3! It's awesome.
— Duncan Geere 🔰 (@duncangeere) April 9, 2020
I'm still getting the hang of it, but I plotted a few things last night and this morning, including one of @revdancatt's perlin landscapes.
Looking forward to getting much deeper into how it all works over the weekend... pic.twitter.com/MsxNedgIJu
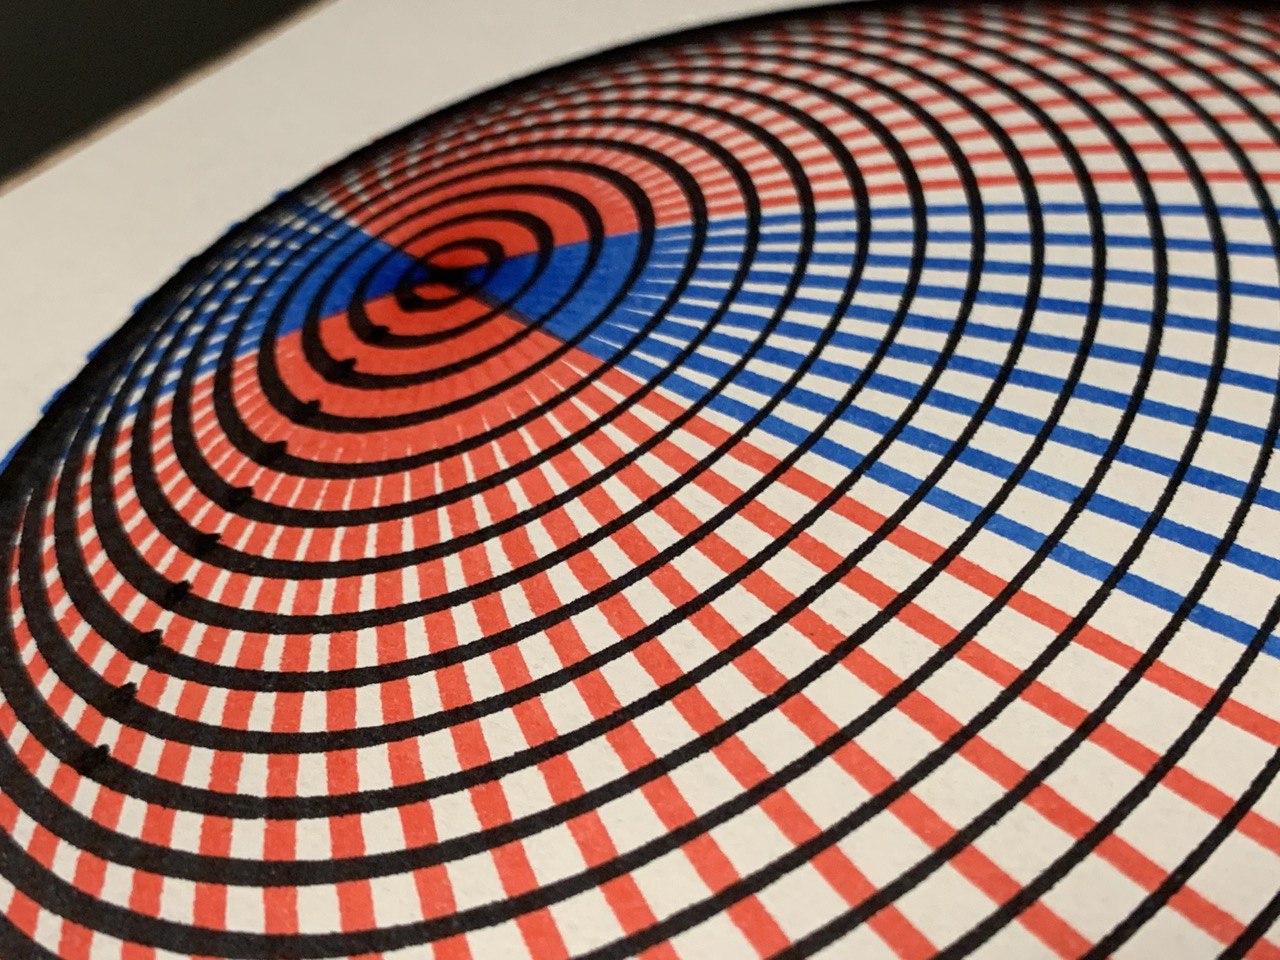
Levelling Up
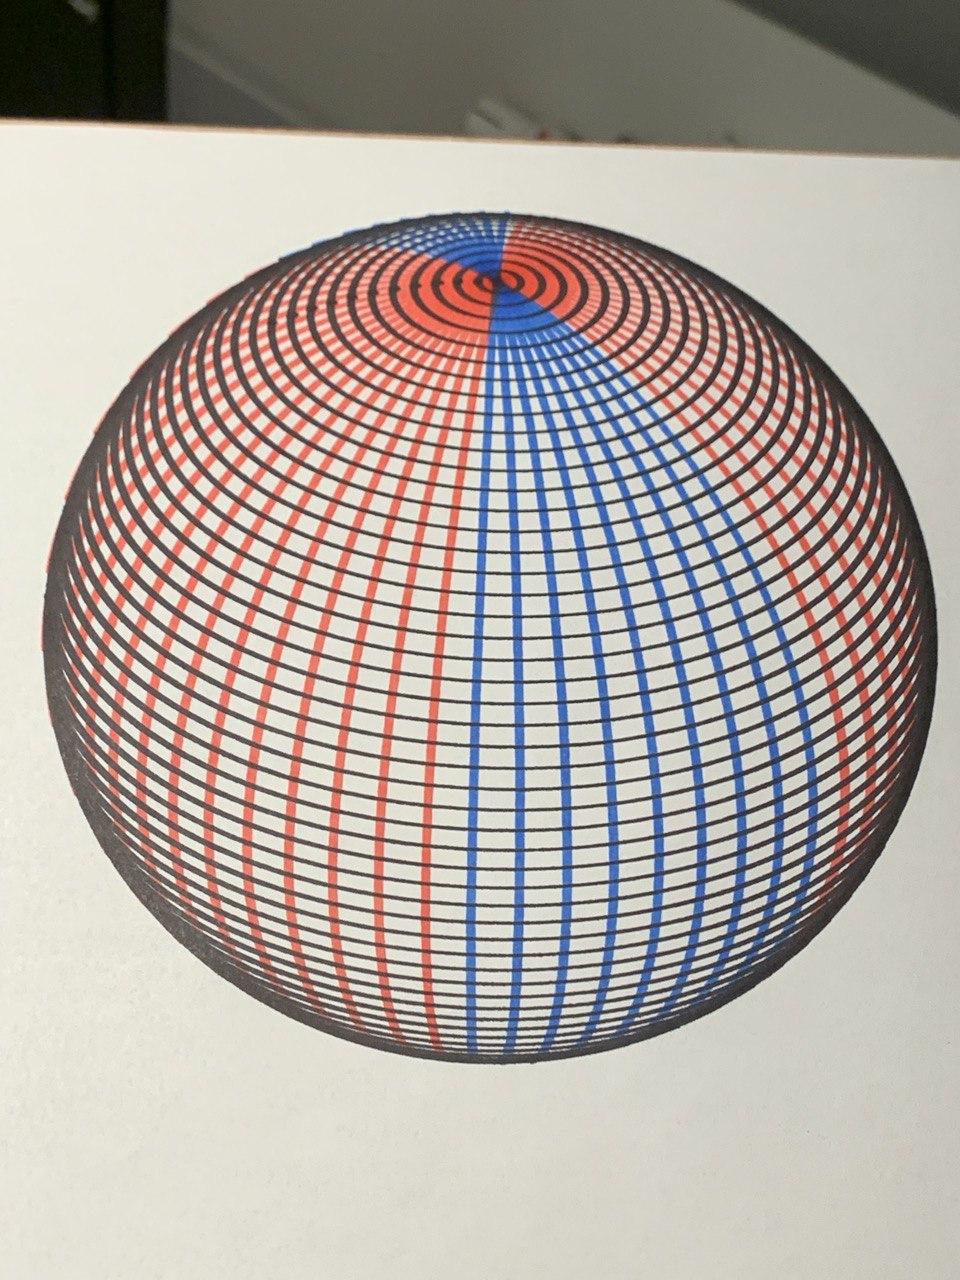
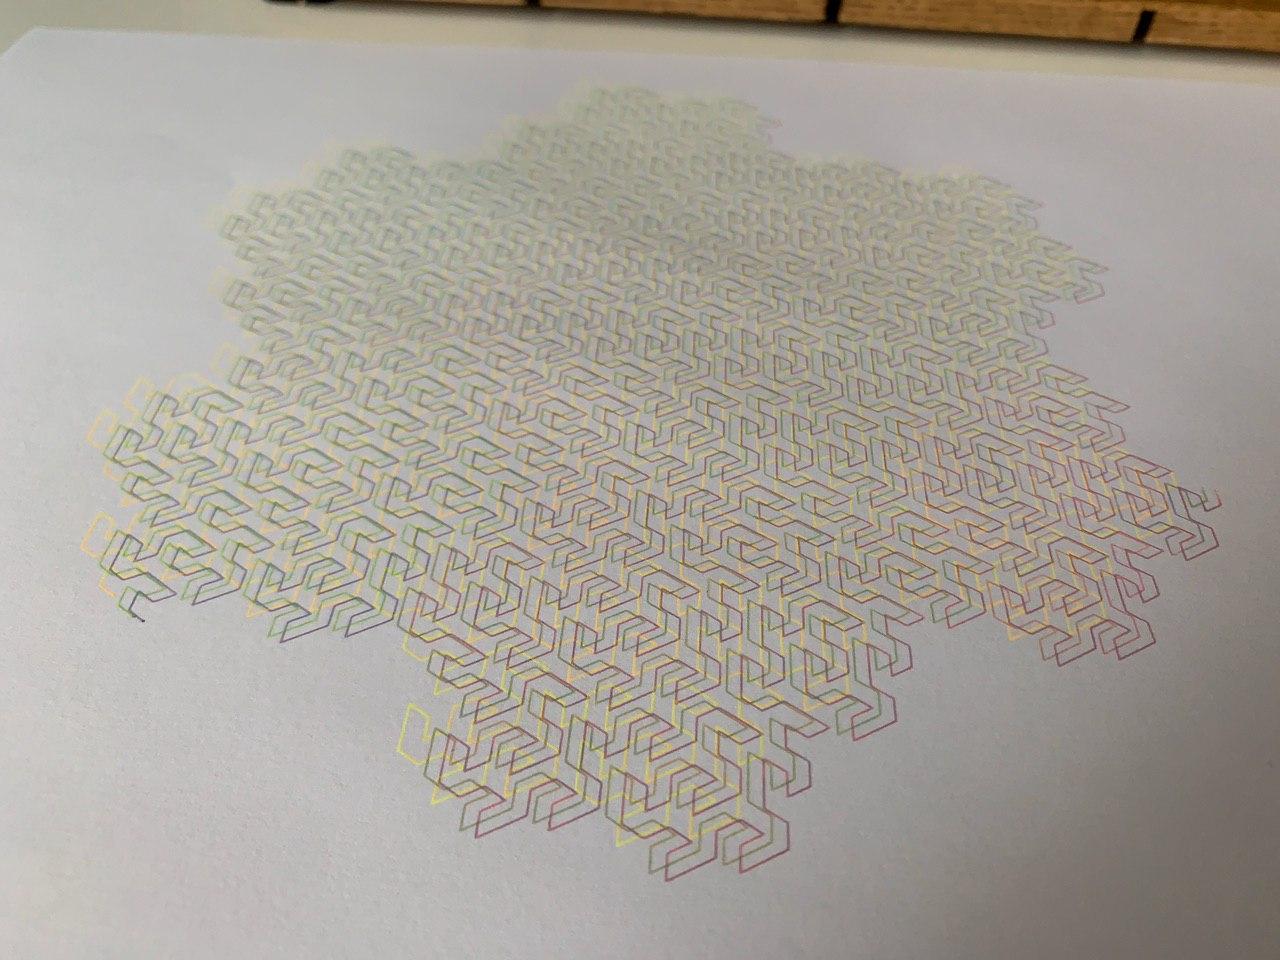
You can see a few experiments above with multiple pens. We did this just by pausing a plot, swapping the pen out, then resuming. But the software actually has a neat way of using layers in SVG files to allow you to plot different things with different pens. That, and some fiddling with the settings, led to some cooler plots.
We also invested in a lot of stationary. A loooooooot.
Also I may have gone overboard on supplies 😅 pic.twitter.com/iTmkdDhxov
— Duncan Geere 🔰 (@duncangeere) April 10, 2020
Oh, and we plotted Laika, our dog, with the help of Maks Surguy's SquiggleCam.
I knew it wouldn't be long before we plotted our dog. #plottertwitter pic.twitter.com/HDI7Kd9KxC
— Duncan Geere 🔰 (@duncangeere) April 12, 2020
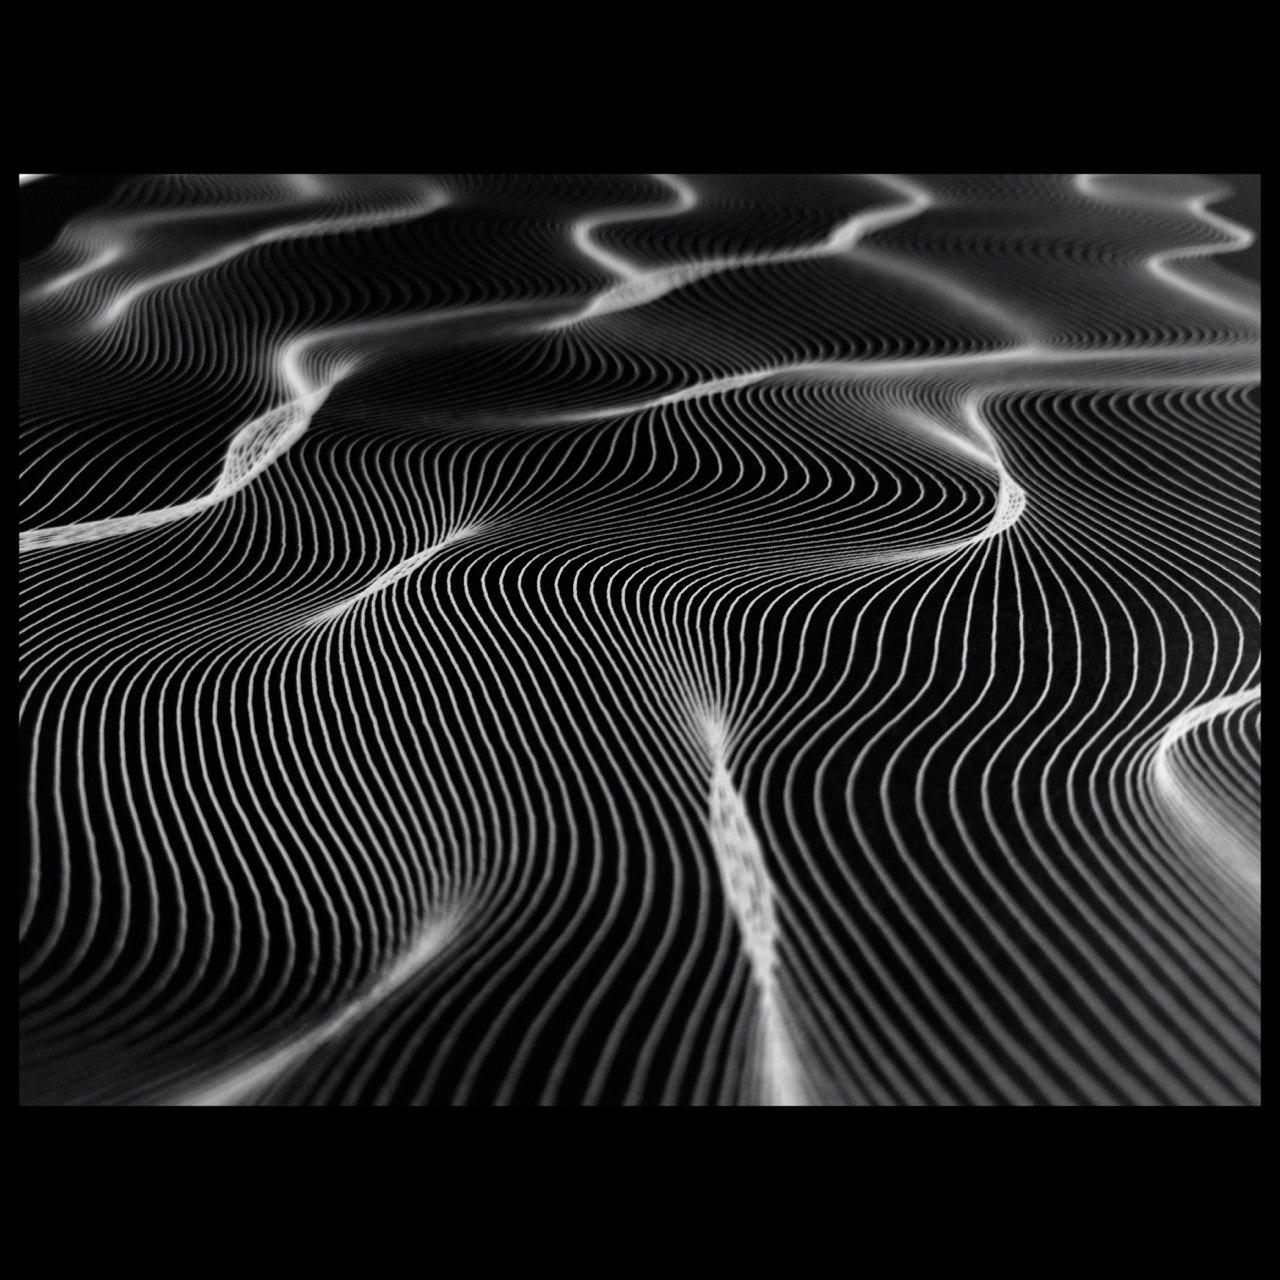
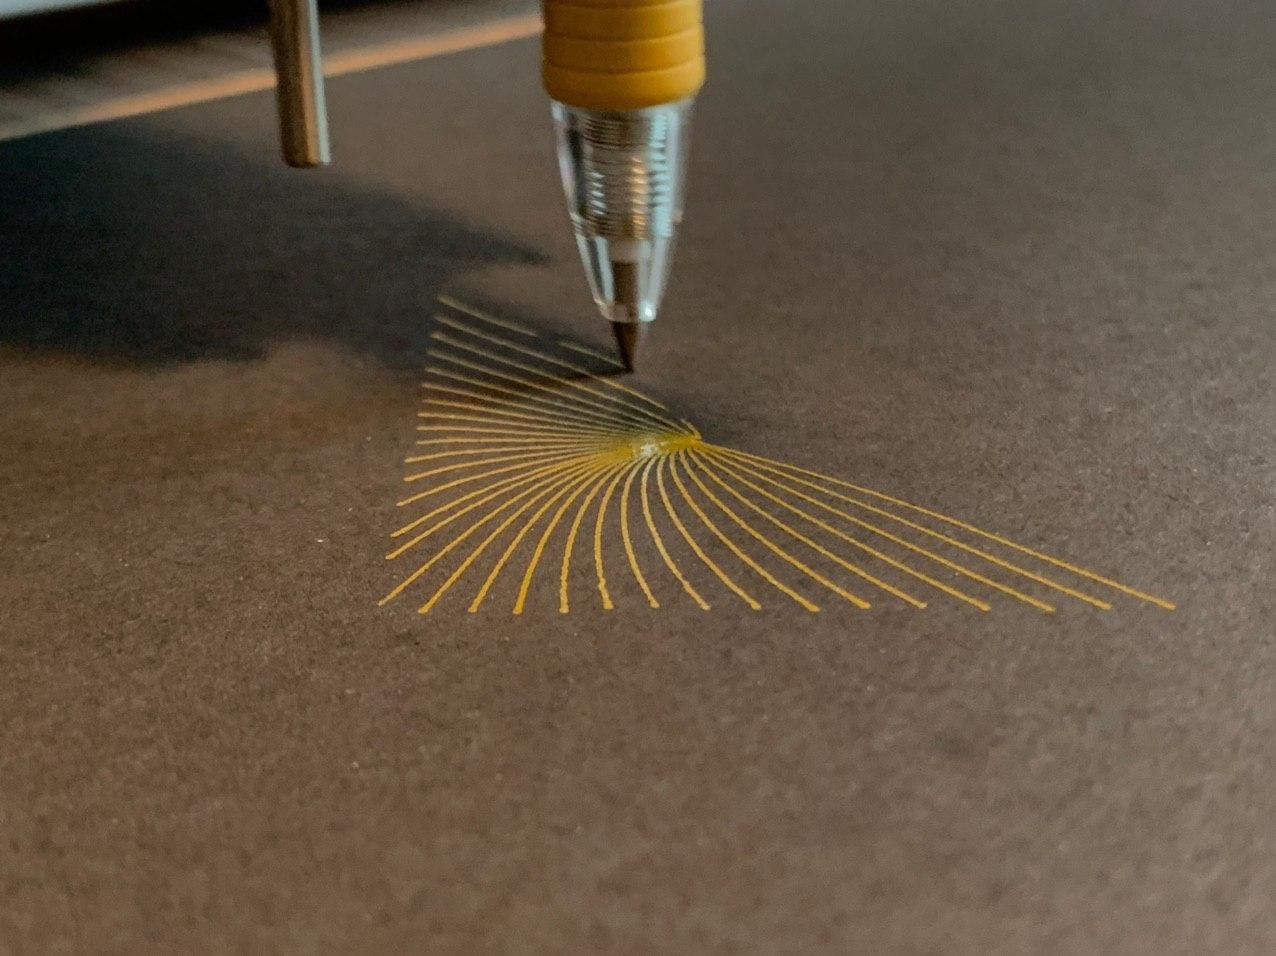
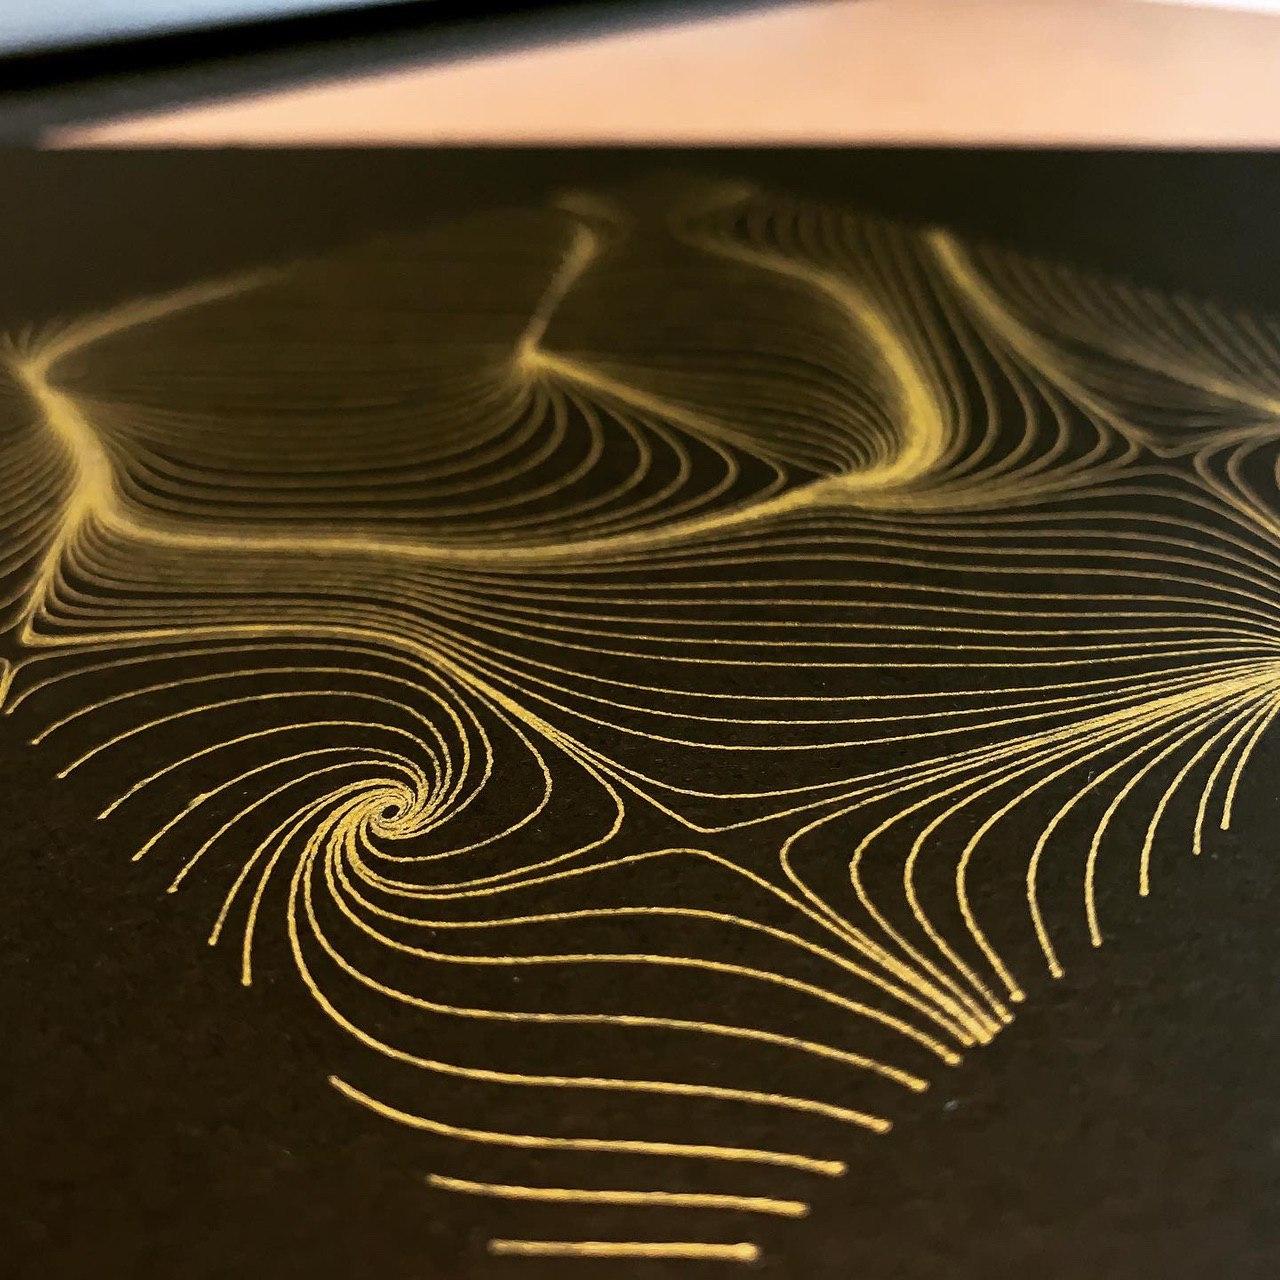
Plotting on Black
Finally, I tried a couple of plots on black cardstock, which looks seriously good. I thought the gold might look tacky, but actually it's really nice.
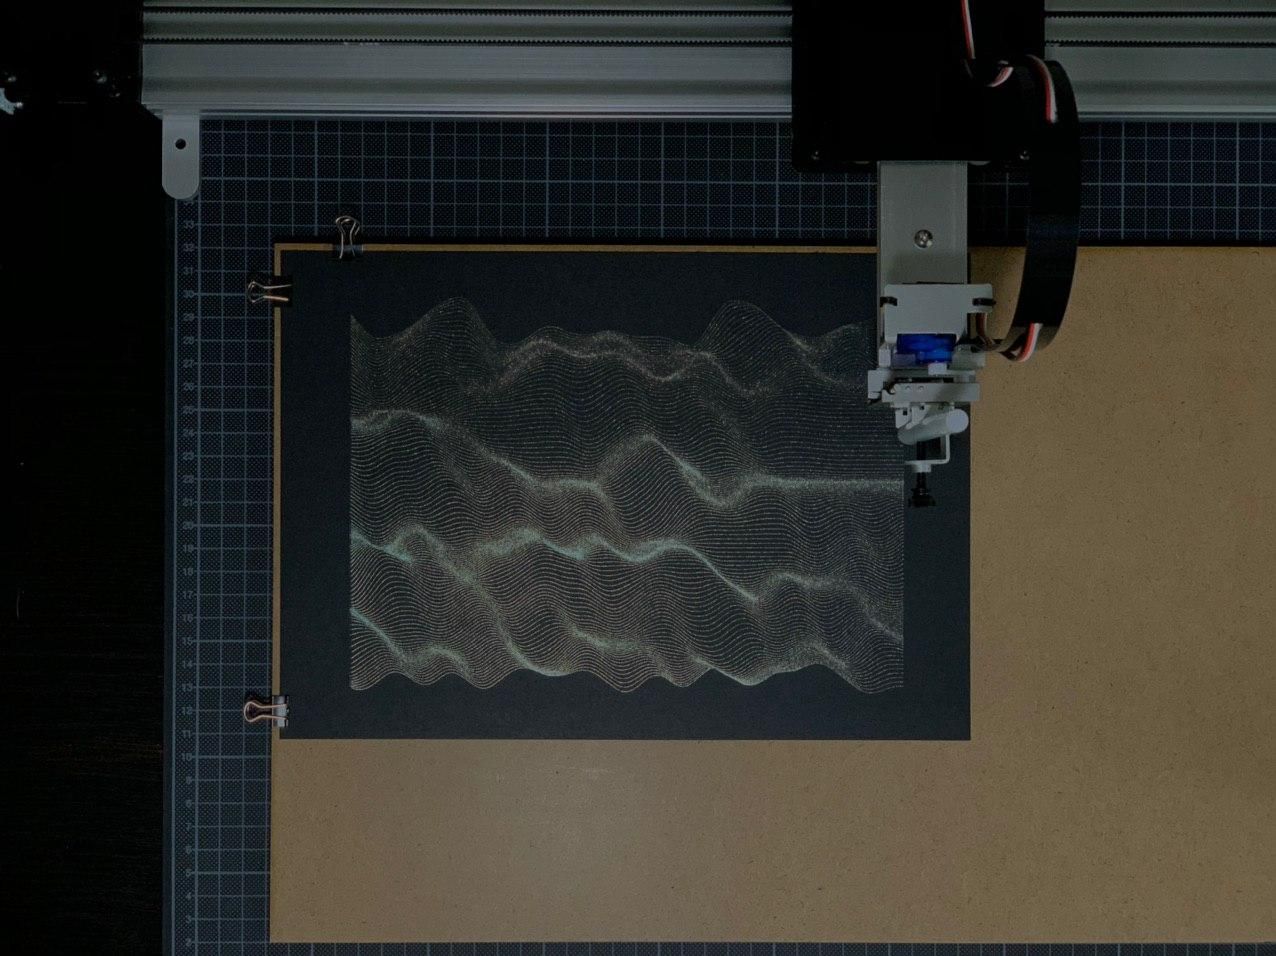
That last one is a bit dark, but if you look carefully you might be able to see a loose thread along the bottom. When I was trying to plug in my laptop, I accidentally unplugged the plotter. I plugged it in again quickly, and it resumed work but with its previous position as the new home position. Will need to try plotting that one again sometime.
Roadblocks
The actual plotting itself is very easy, and you can have a lot of fun with it by plotting artwork created by others or by simple tools created by others. All you need is an SVG.
What I want to do, though, is create the artworks myself – and this is where I hit the weekend's biggest frustration. Turns out that there aren't really good ways to export SVG artwork from my main generative art tool, P5.js. I tried various hacky workarounds, but none of them delivered the results that I wanted.
Instead, I'm going to opt for another library. Rune.js looks like exactly what I'm looking for, so I'm working through the tutorial there. I might also try doing some generative bits with the Scripter plugin in Figma. I'll keep you posted on those.
In the meantime, I'll keep plotting less-geometric things - terrain from QGIS, charts, maybe some typographic works would be fun.
If you want to follow our plotter work, I'd recommend following Plottervision on YouTube ("like and subscribe!") and @data_plotter on Twitter and Instagram, as well as my regular Twitter account, @duncangeere.