
Climate Breakdown


Beating climate change requires understanding the causes. Here’s a new graphic I’ve made that breaks down global emissions from 2016 (the latest year with global data available). Data comes from Our World In Data, remixed a little by me.
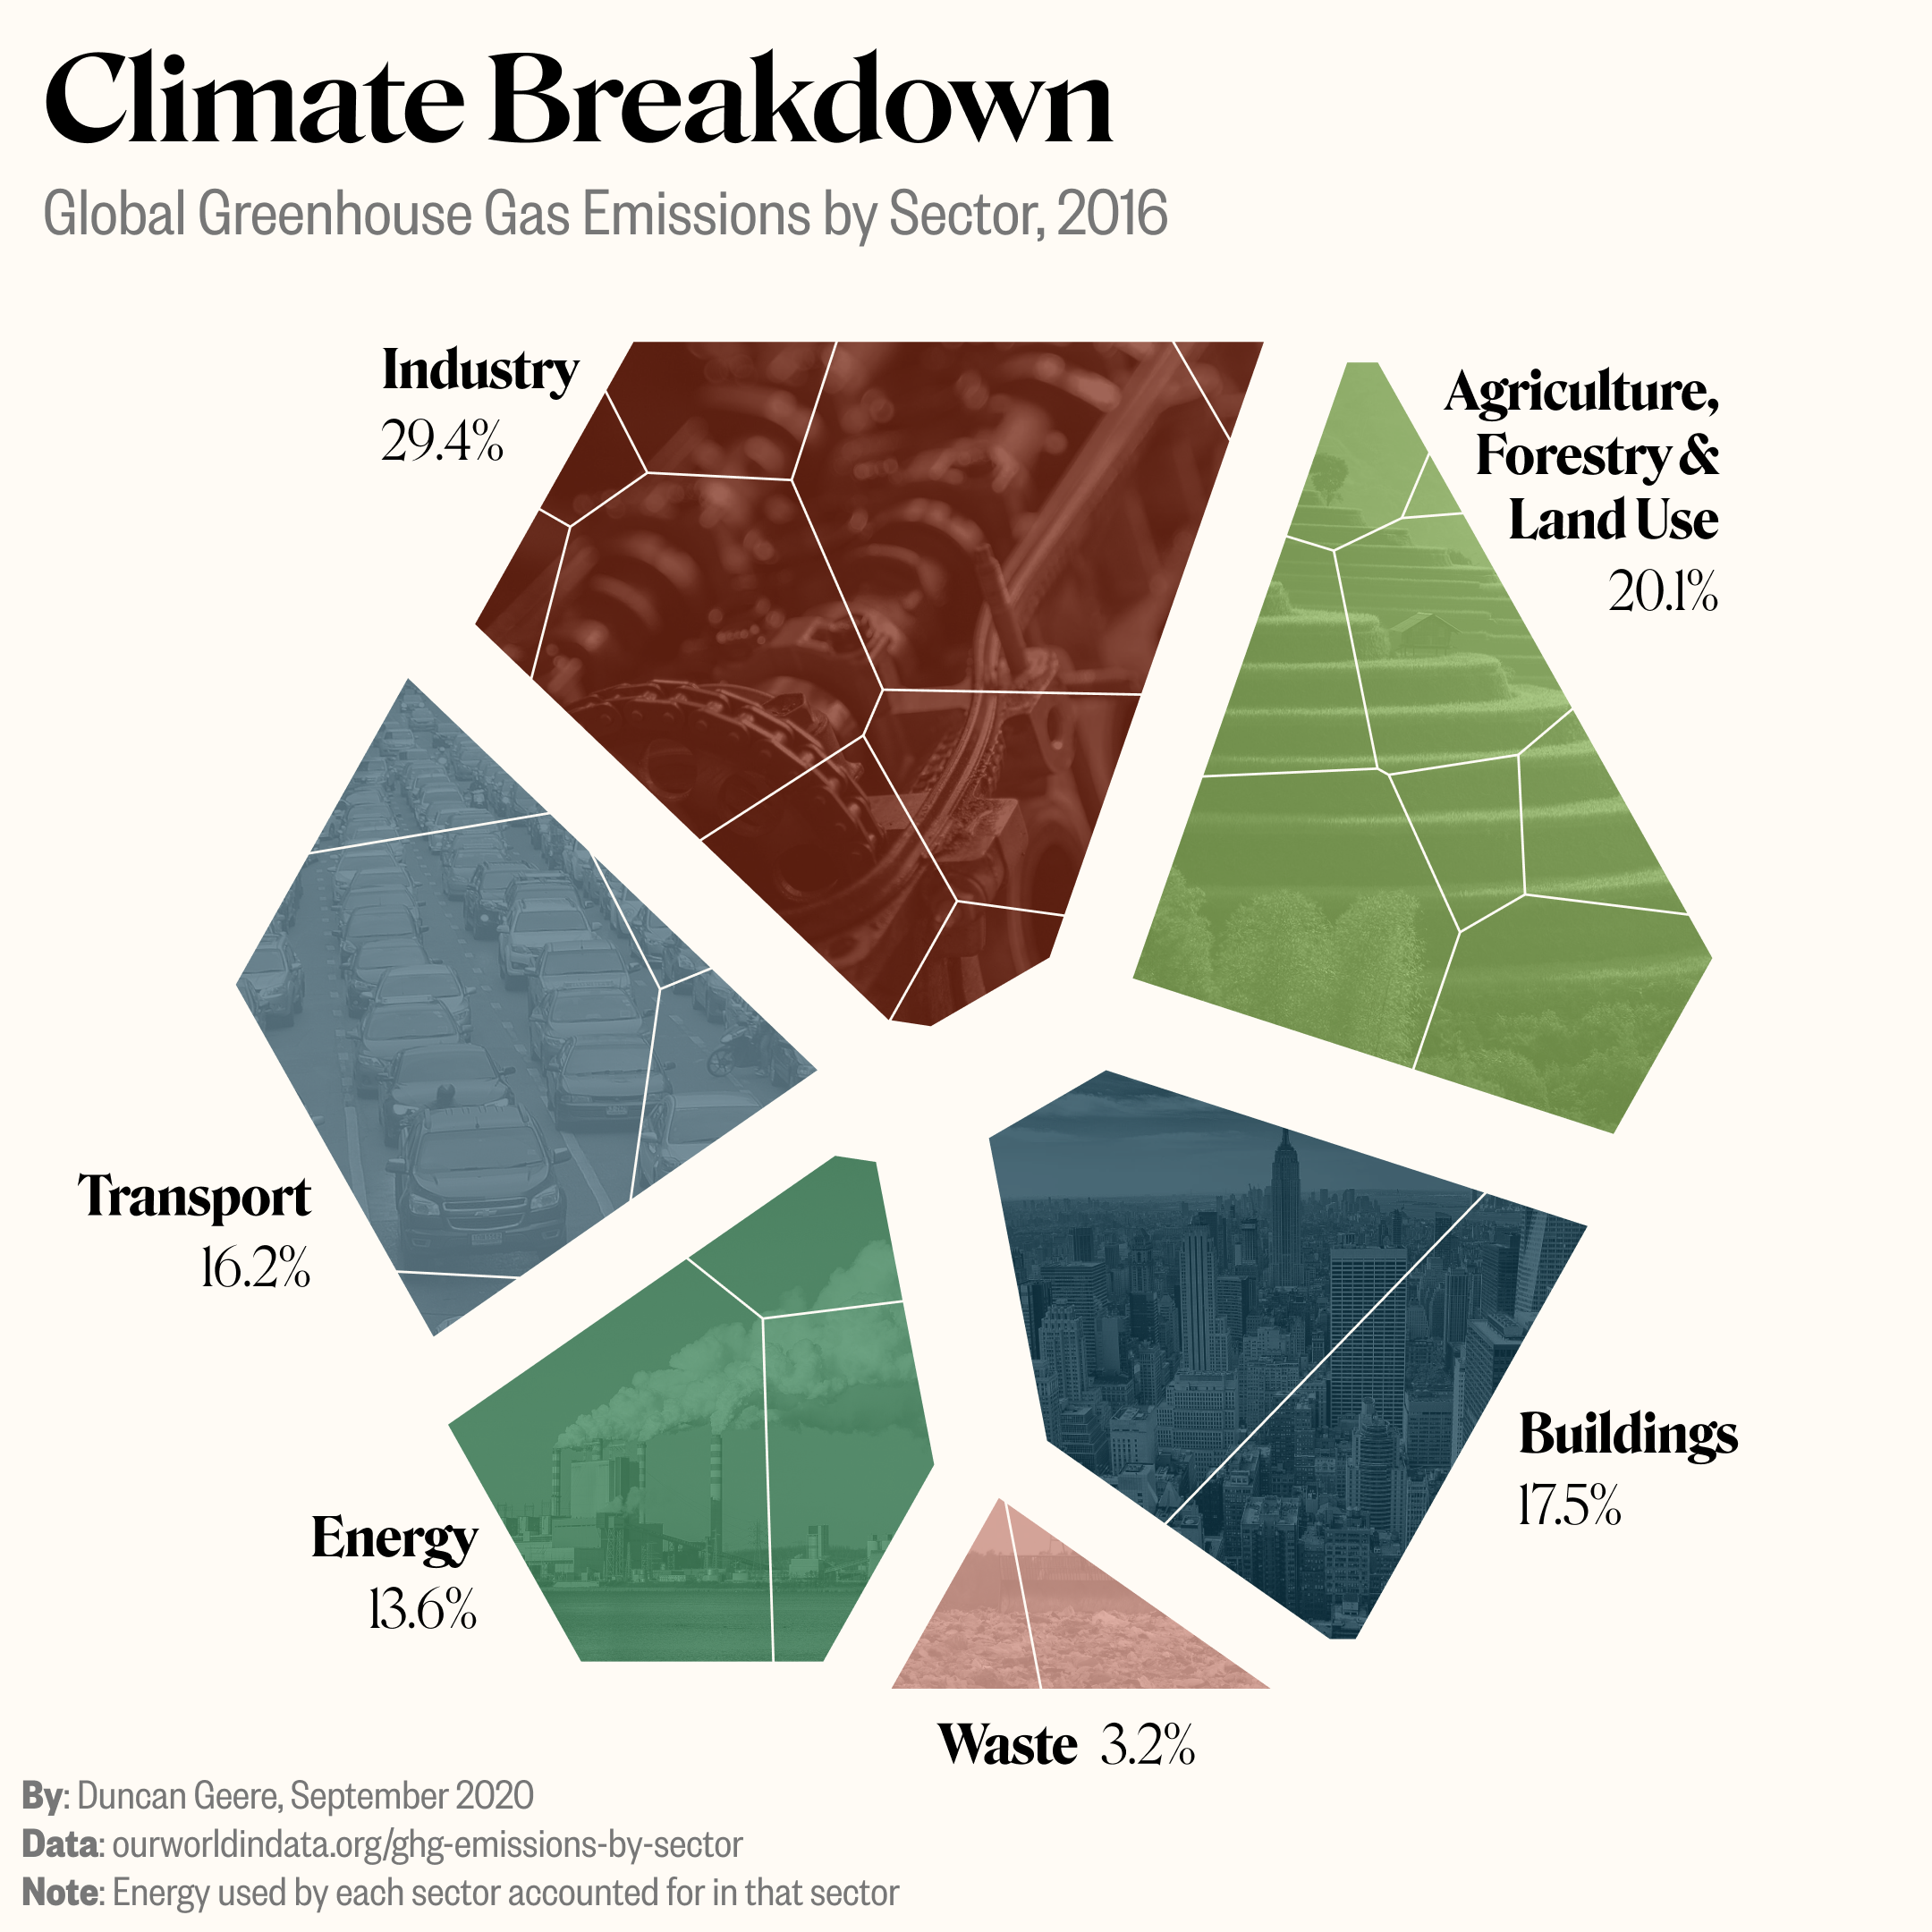
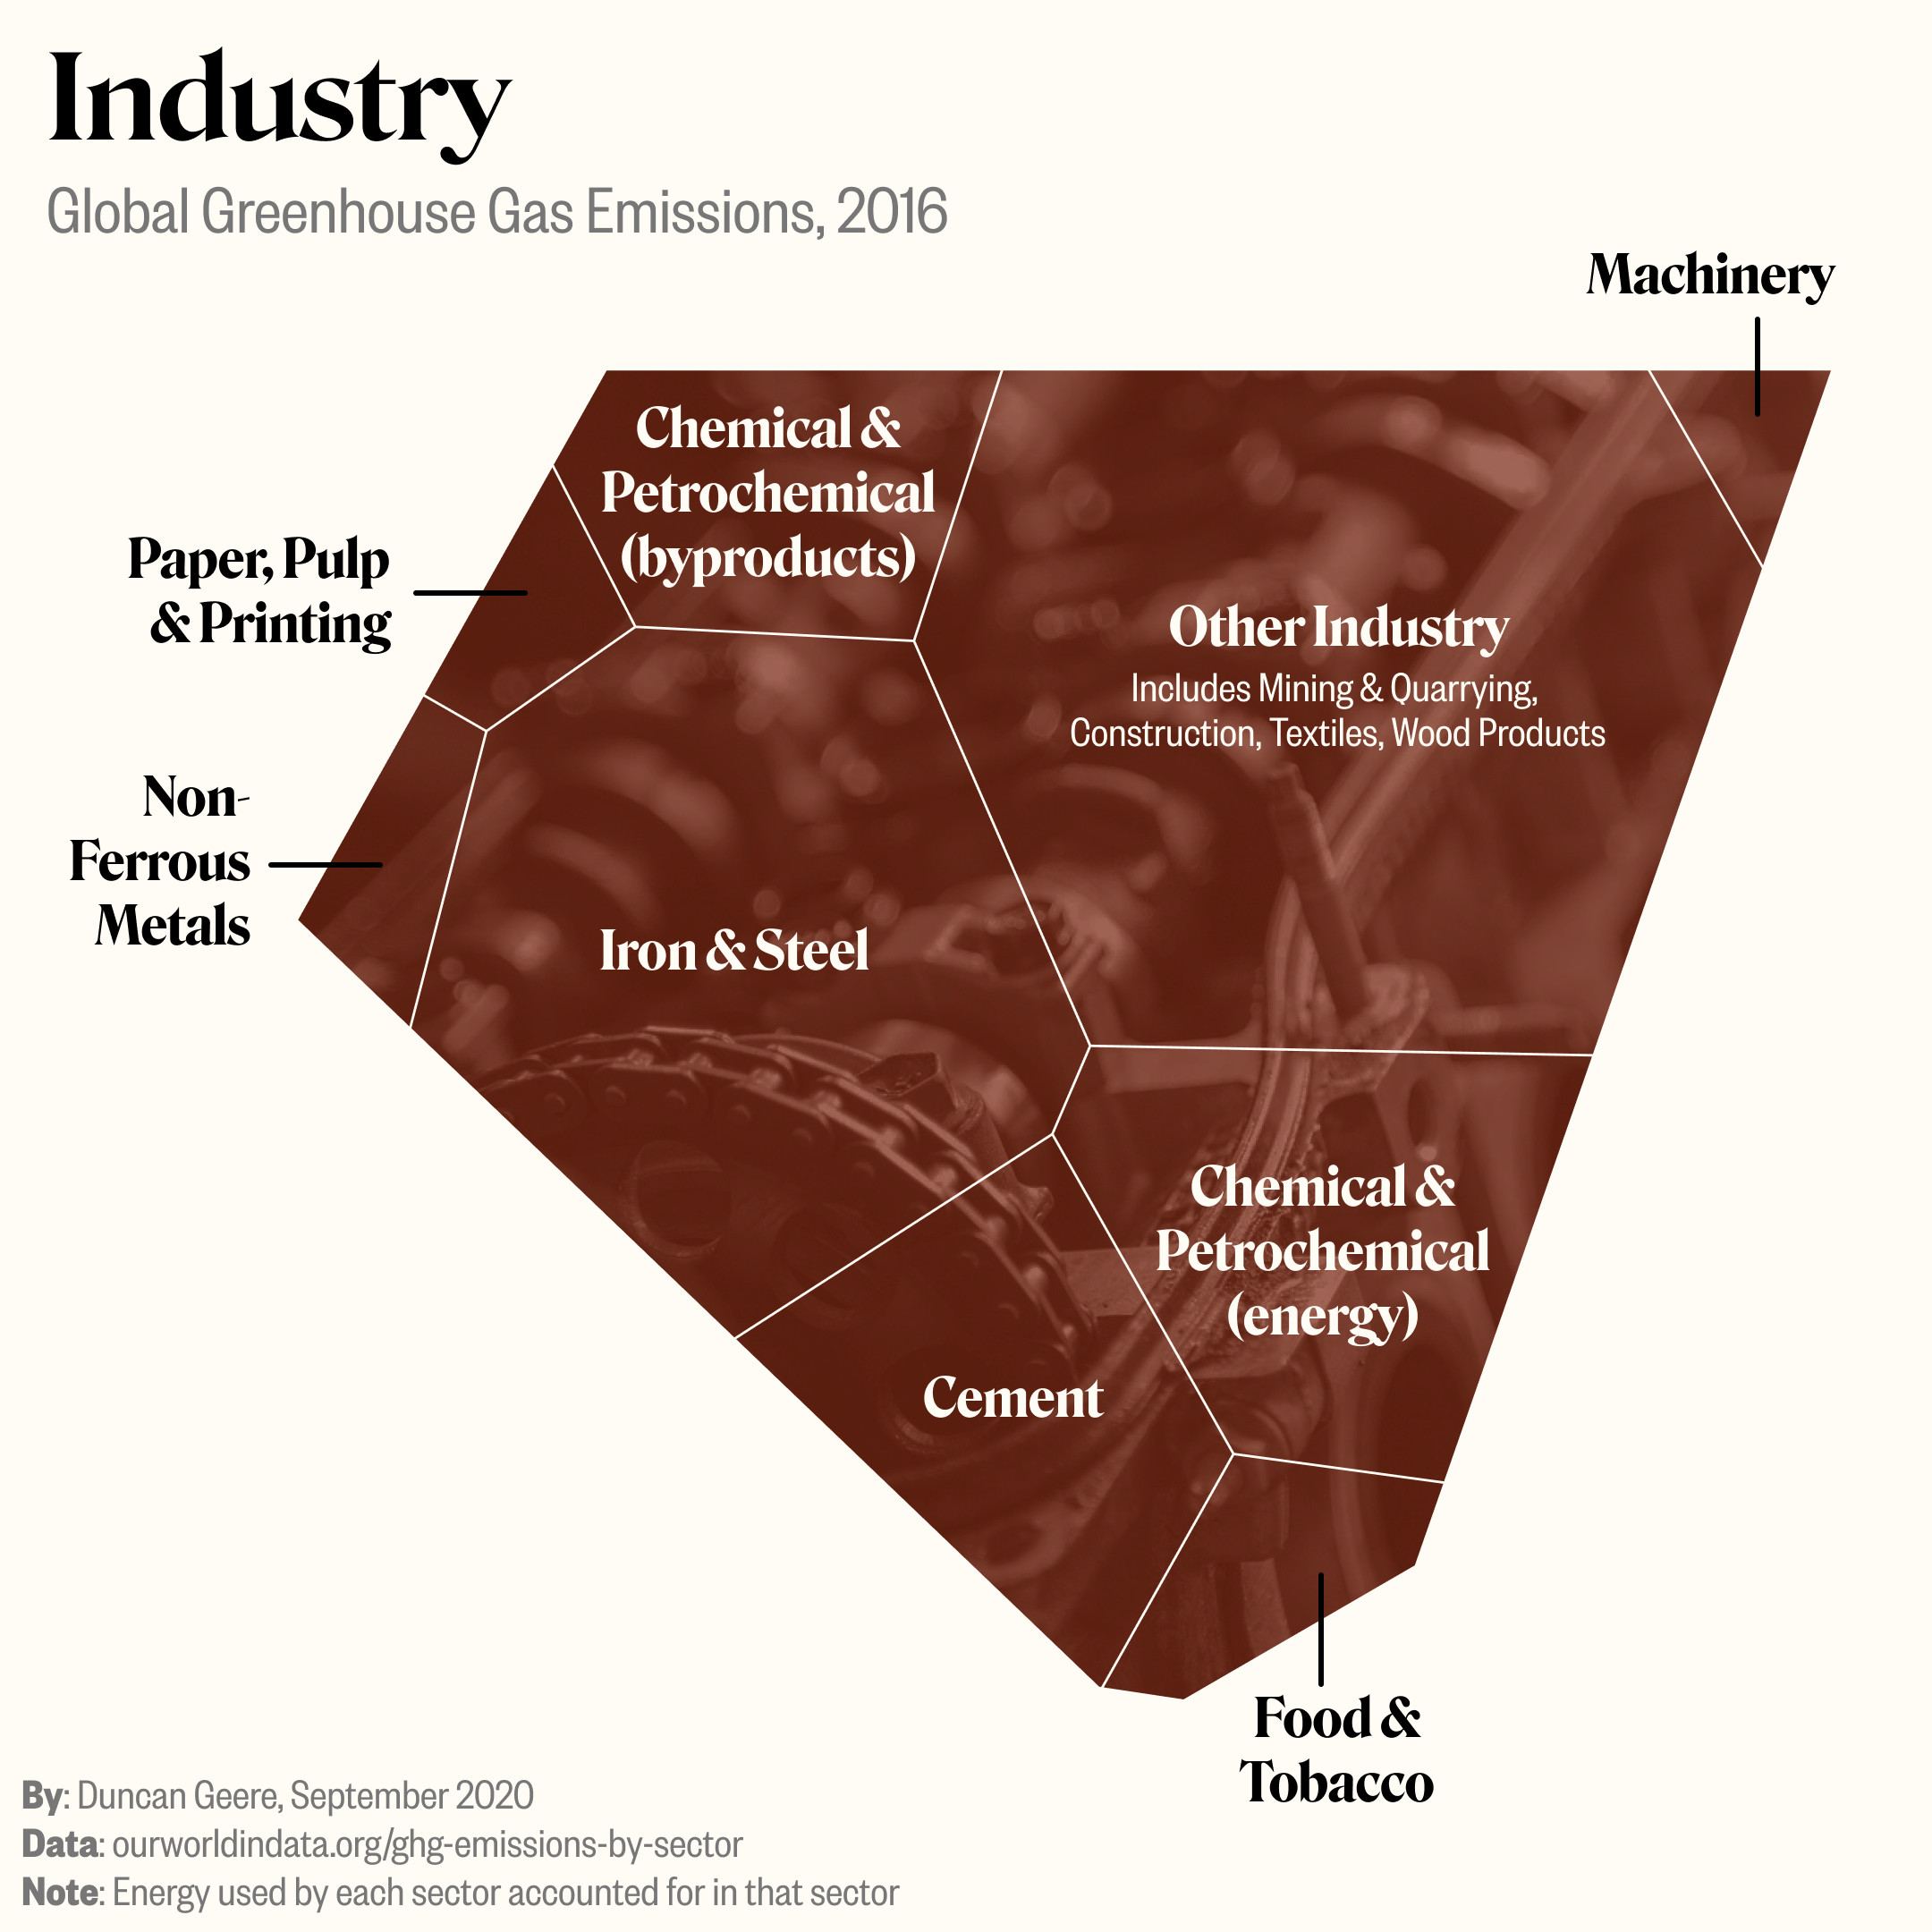
Industry is the largest sector, divided up fairly evenly. The iron and steel industries are the largest individual chunk.
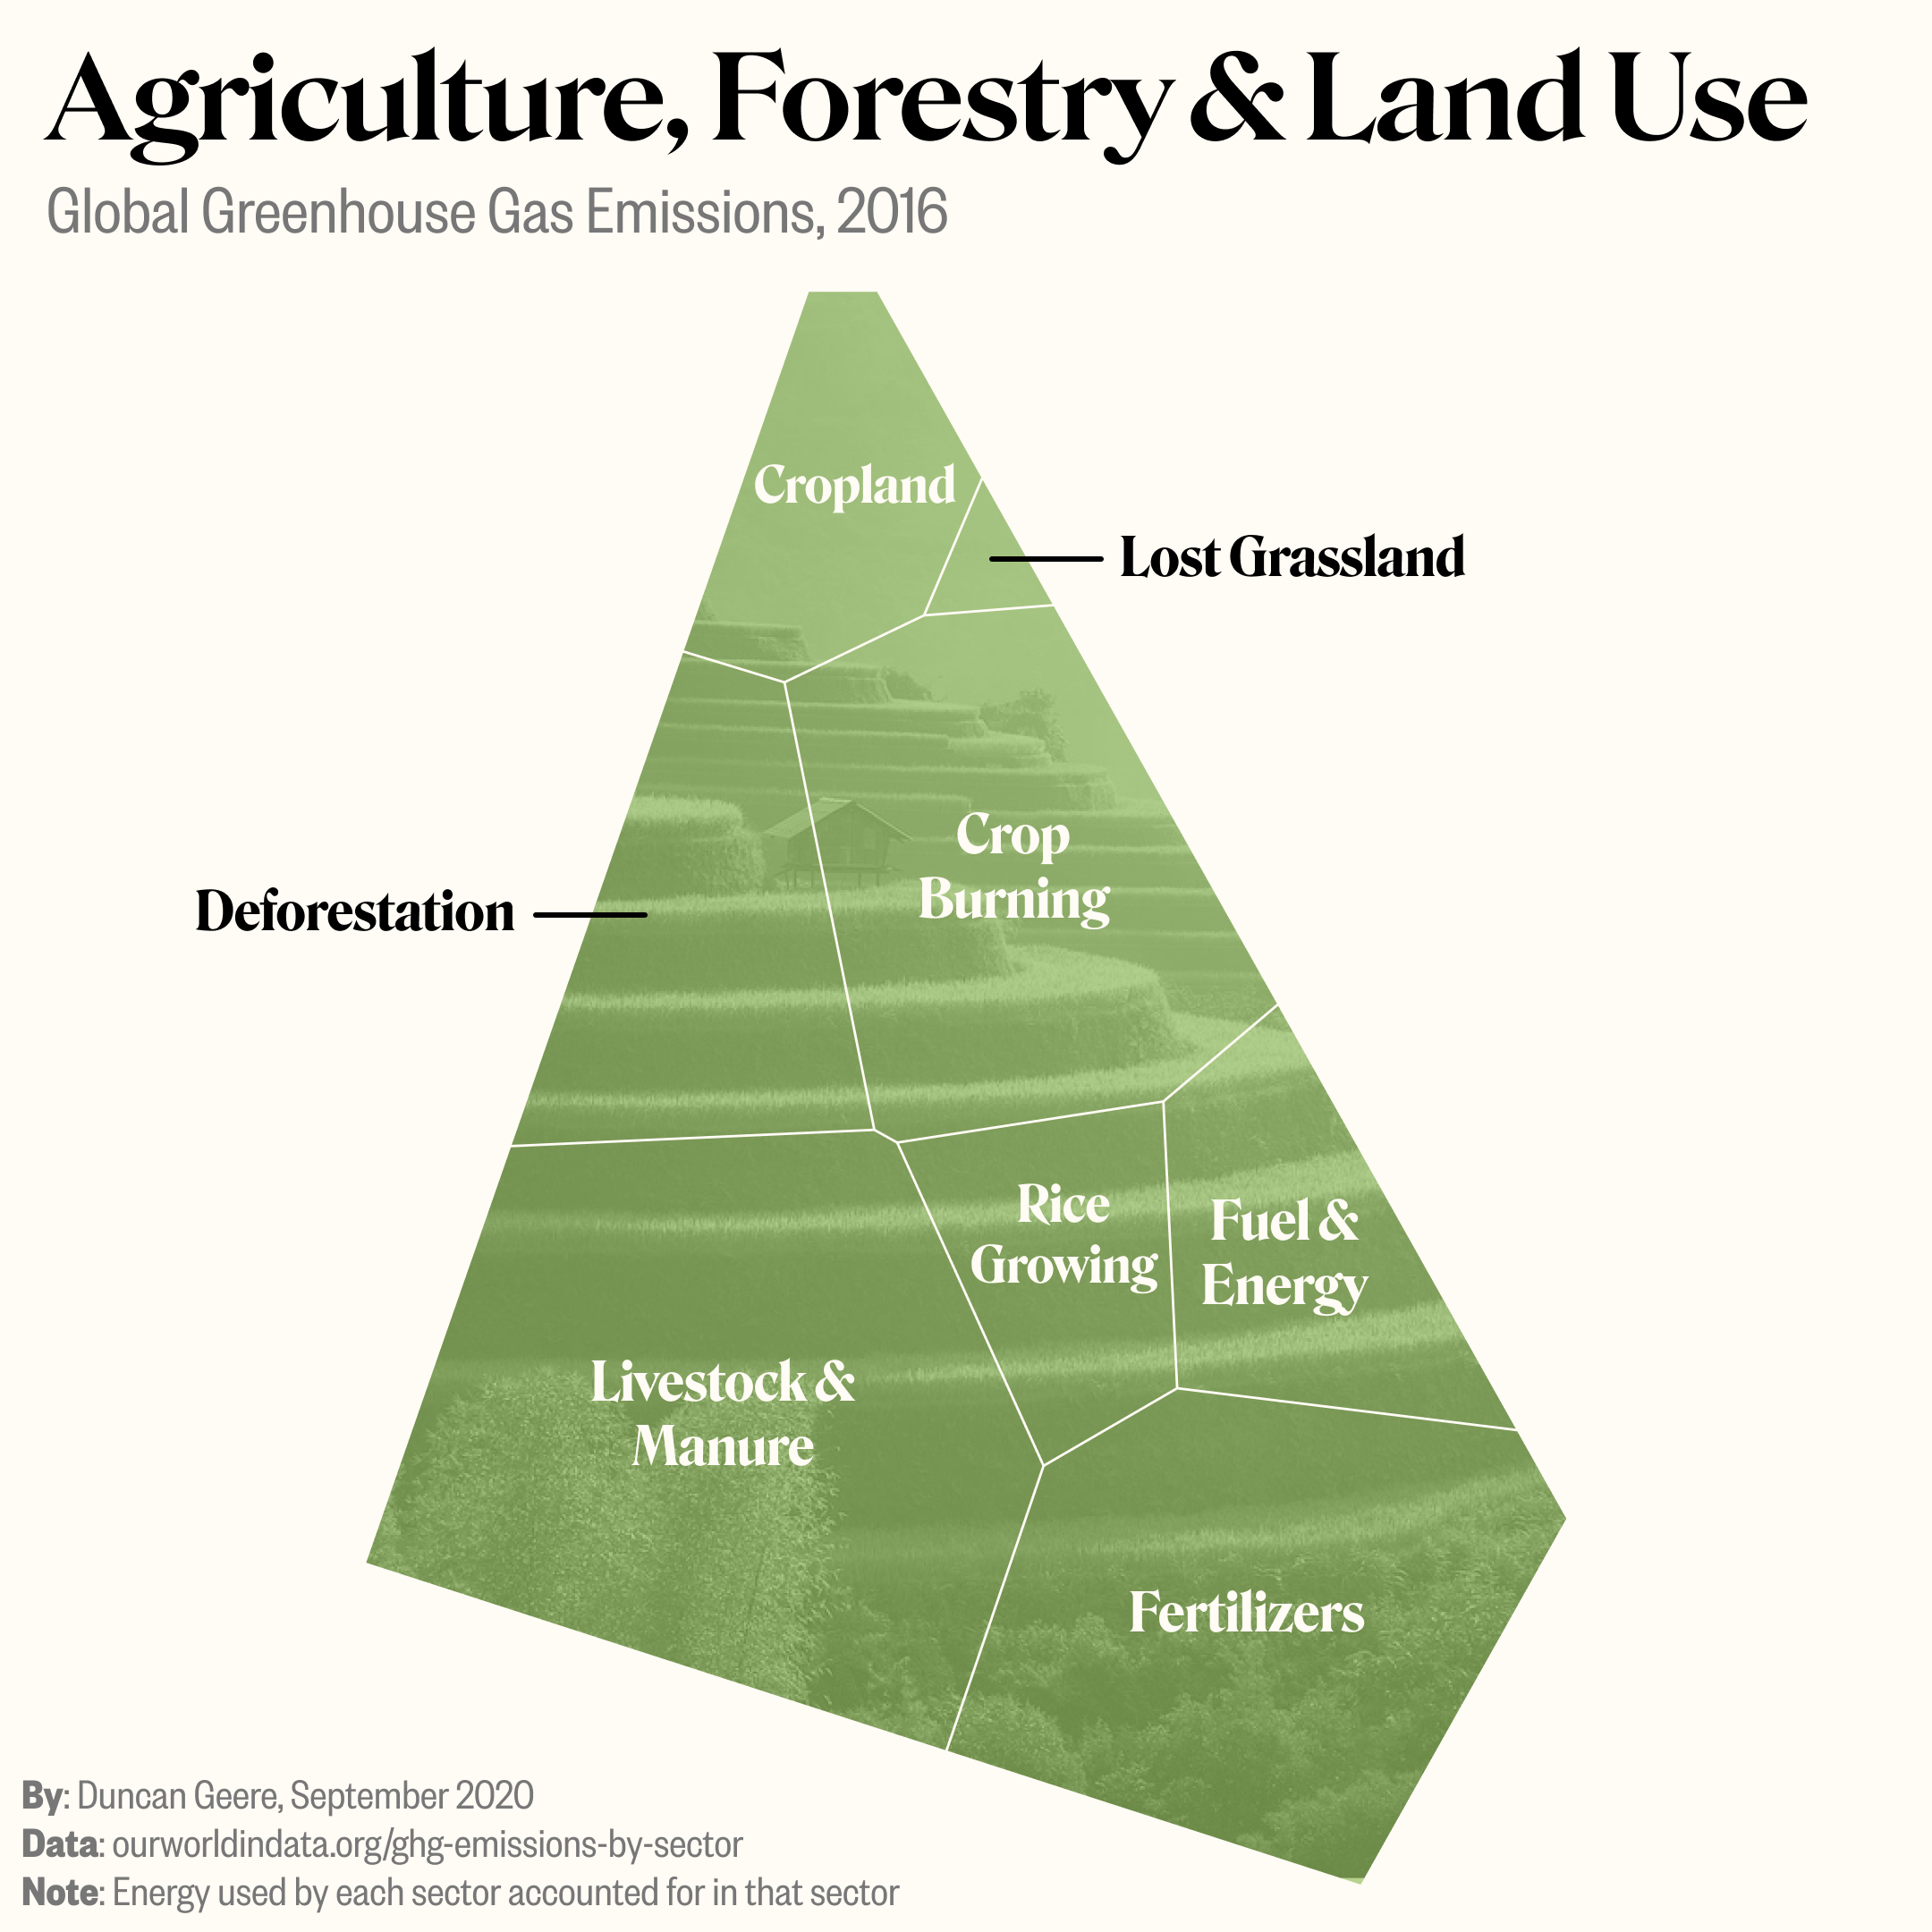
Most agriculture and land use emissions come from livestock, burning what's left after harvests, and deforestation (to make new crop/grazing land). More detail can be found at Our World in Data.
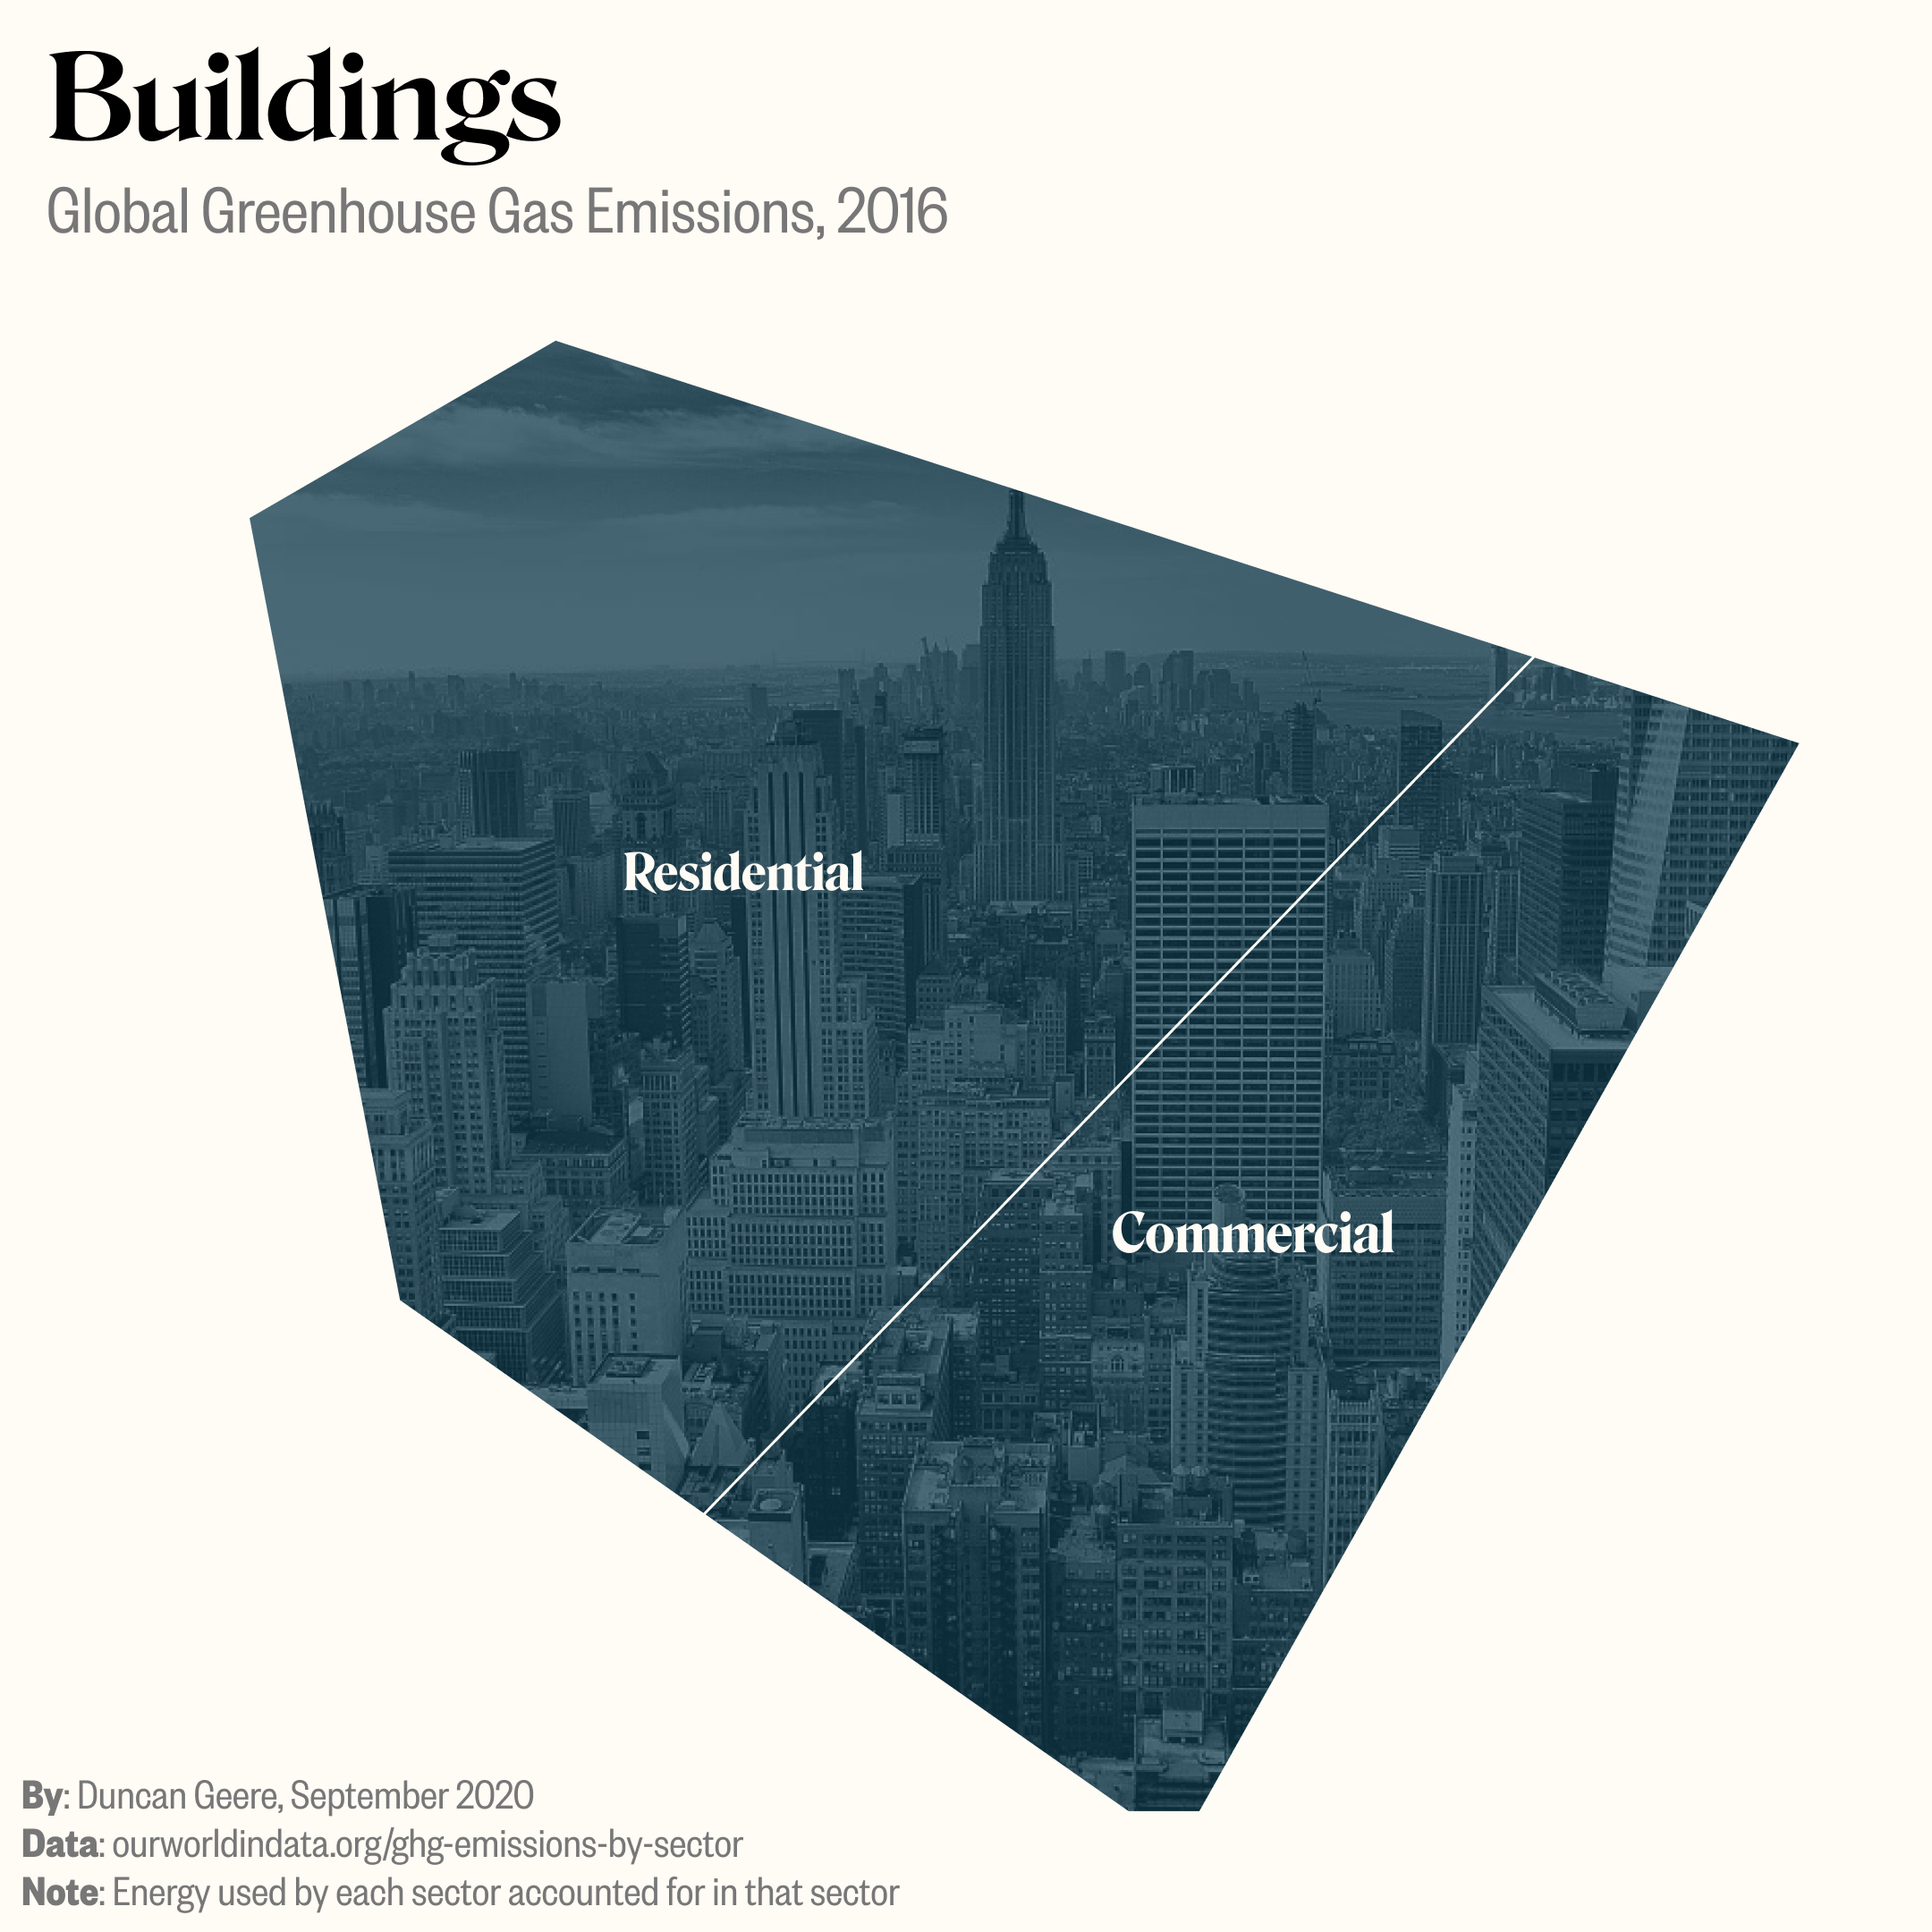
Buildings are the next largest chunk. Residental emissions are about twice the quantity of emissions from commercial buildings. Remember that this is worldwide data.
People talk a lot about air travel, but it's a relatively small slice of global emissions because the majority of the world population doesn't fly. That may start to change in the coming years.
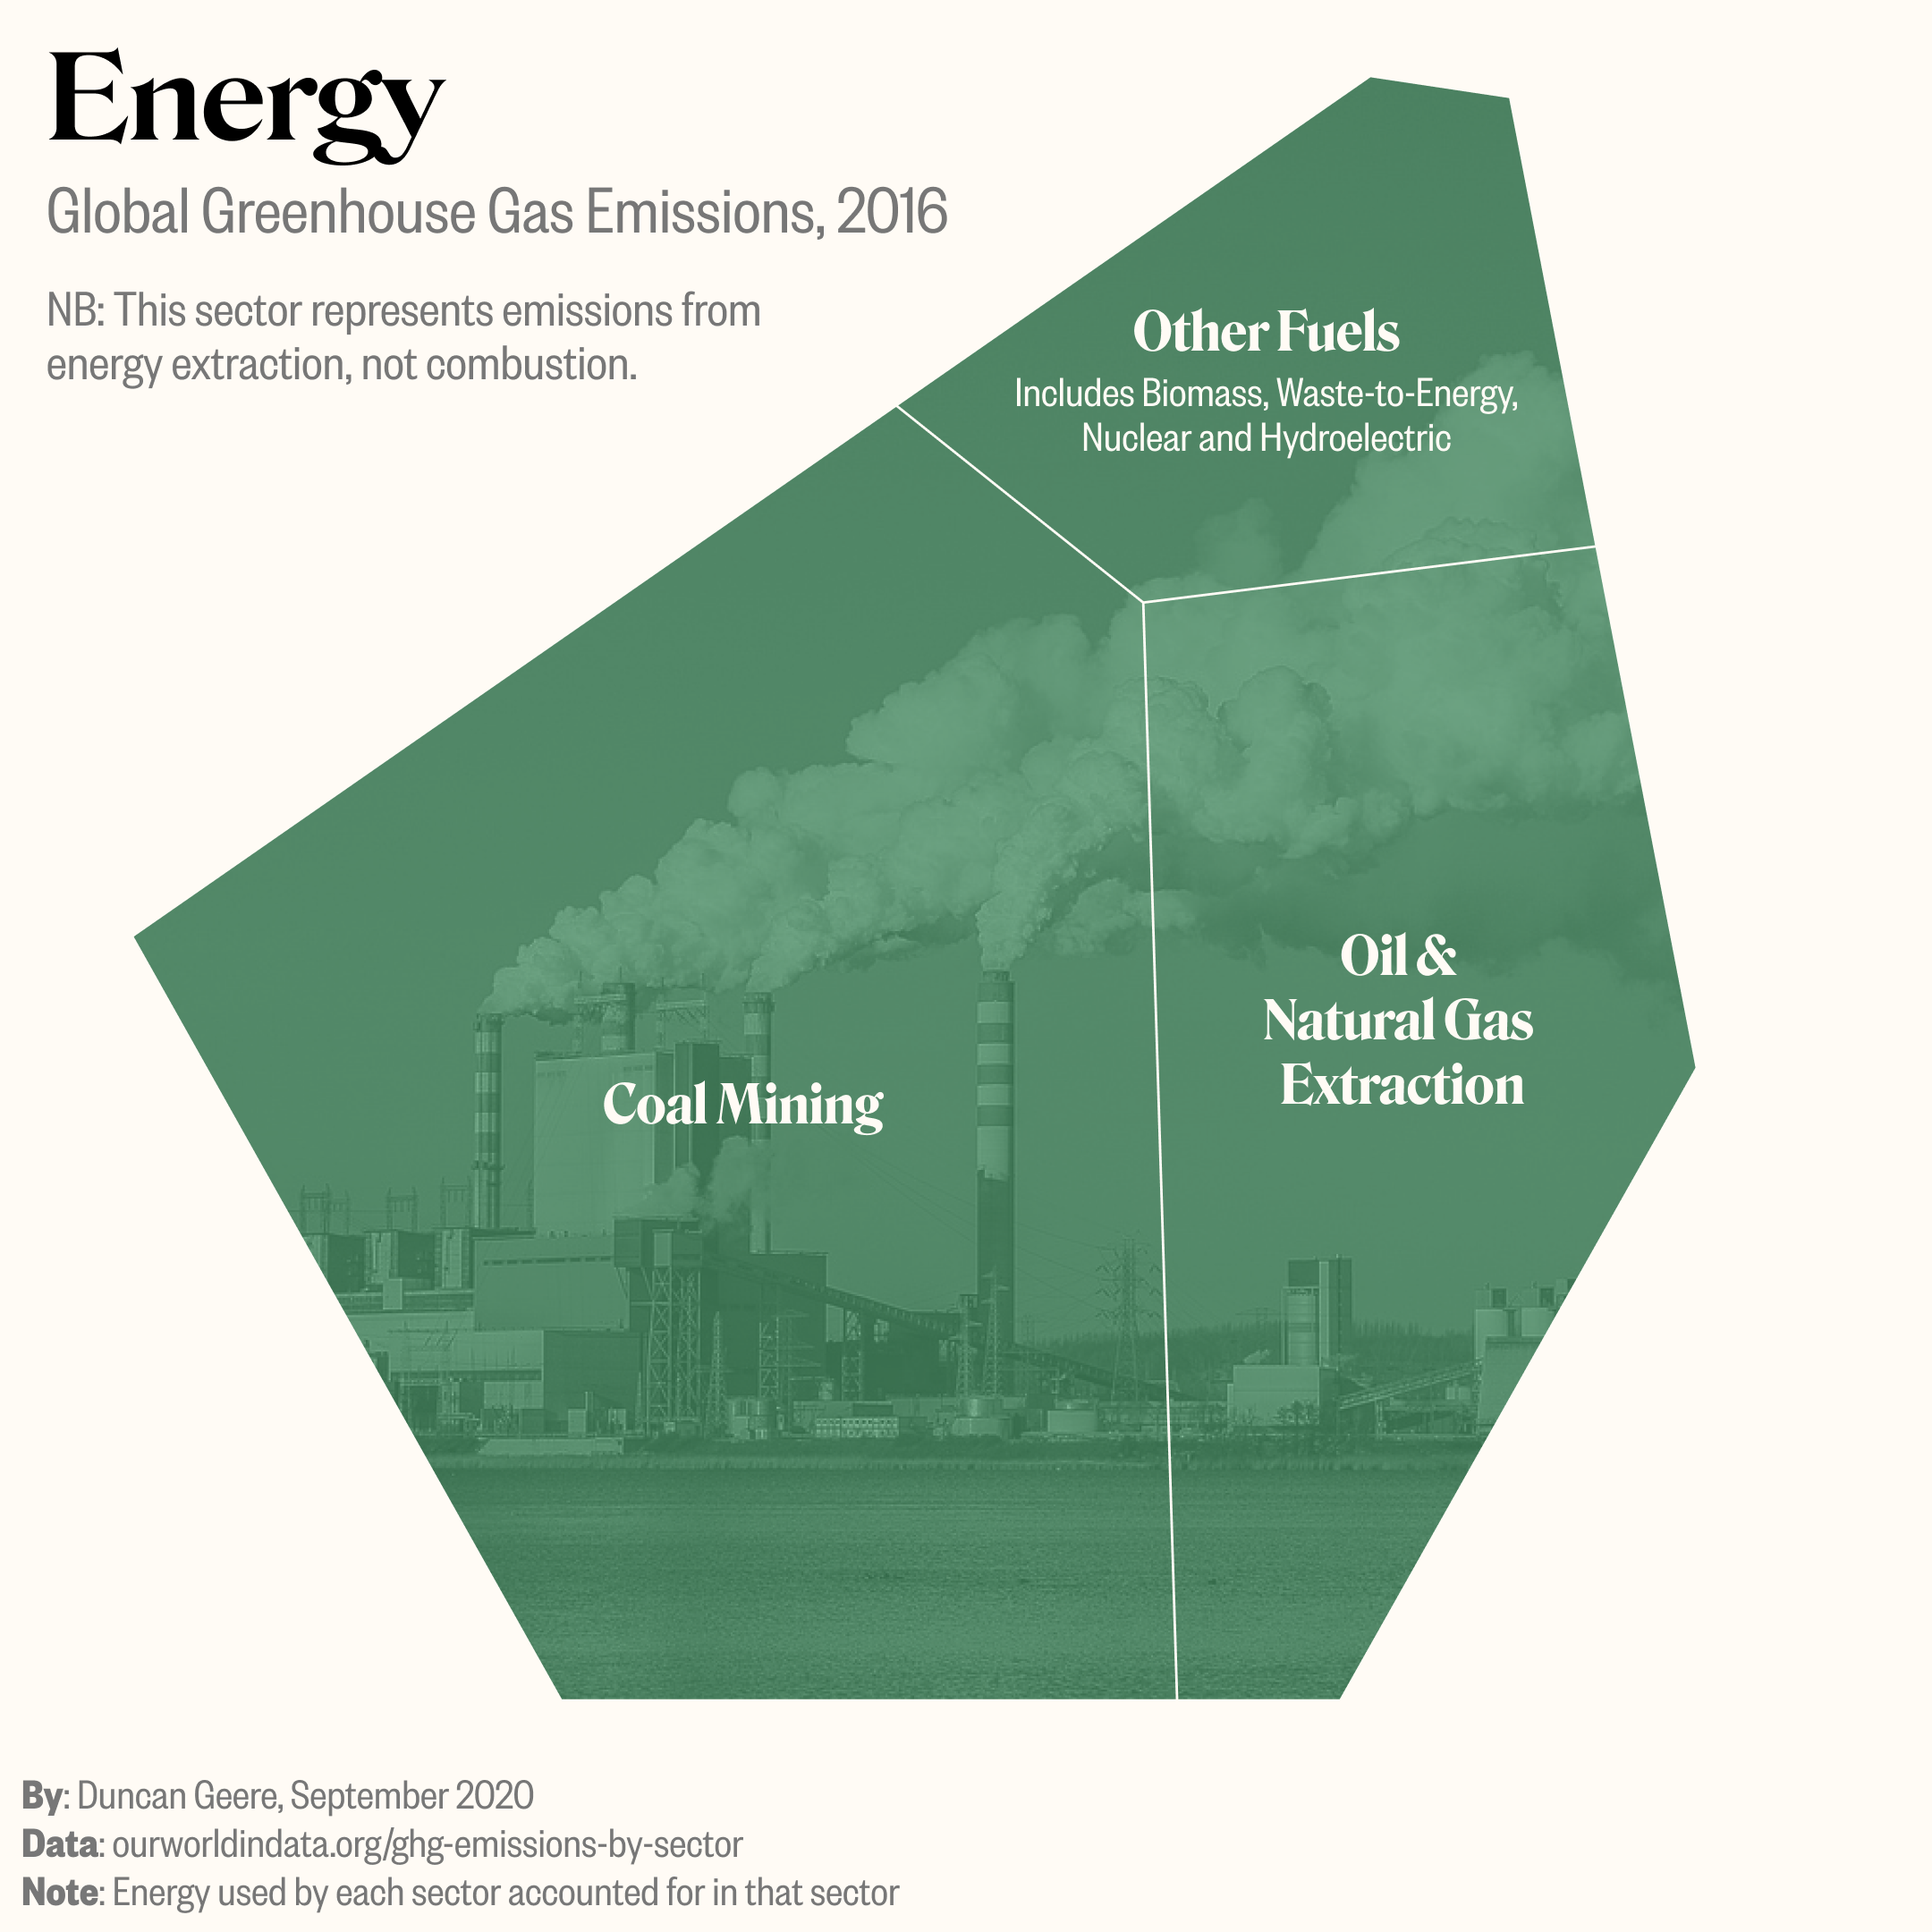
The energy sector mainly represents the emissions caused by getting fossil fuels out of the ground. The energy consumed by other industries is accounted for in those industries. This is the main difference between my analysis and the one from Our World in Data (which lumped all energy emissions together).
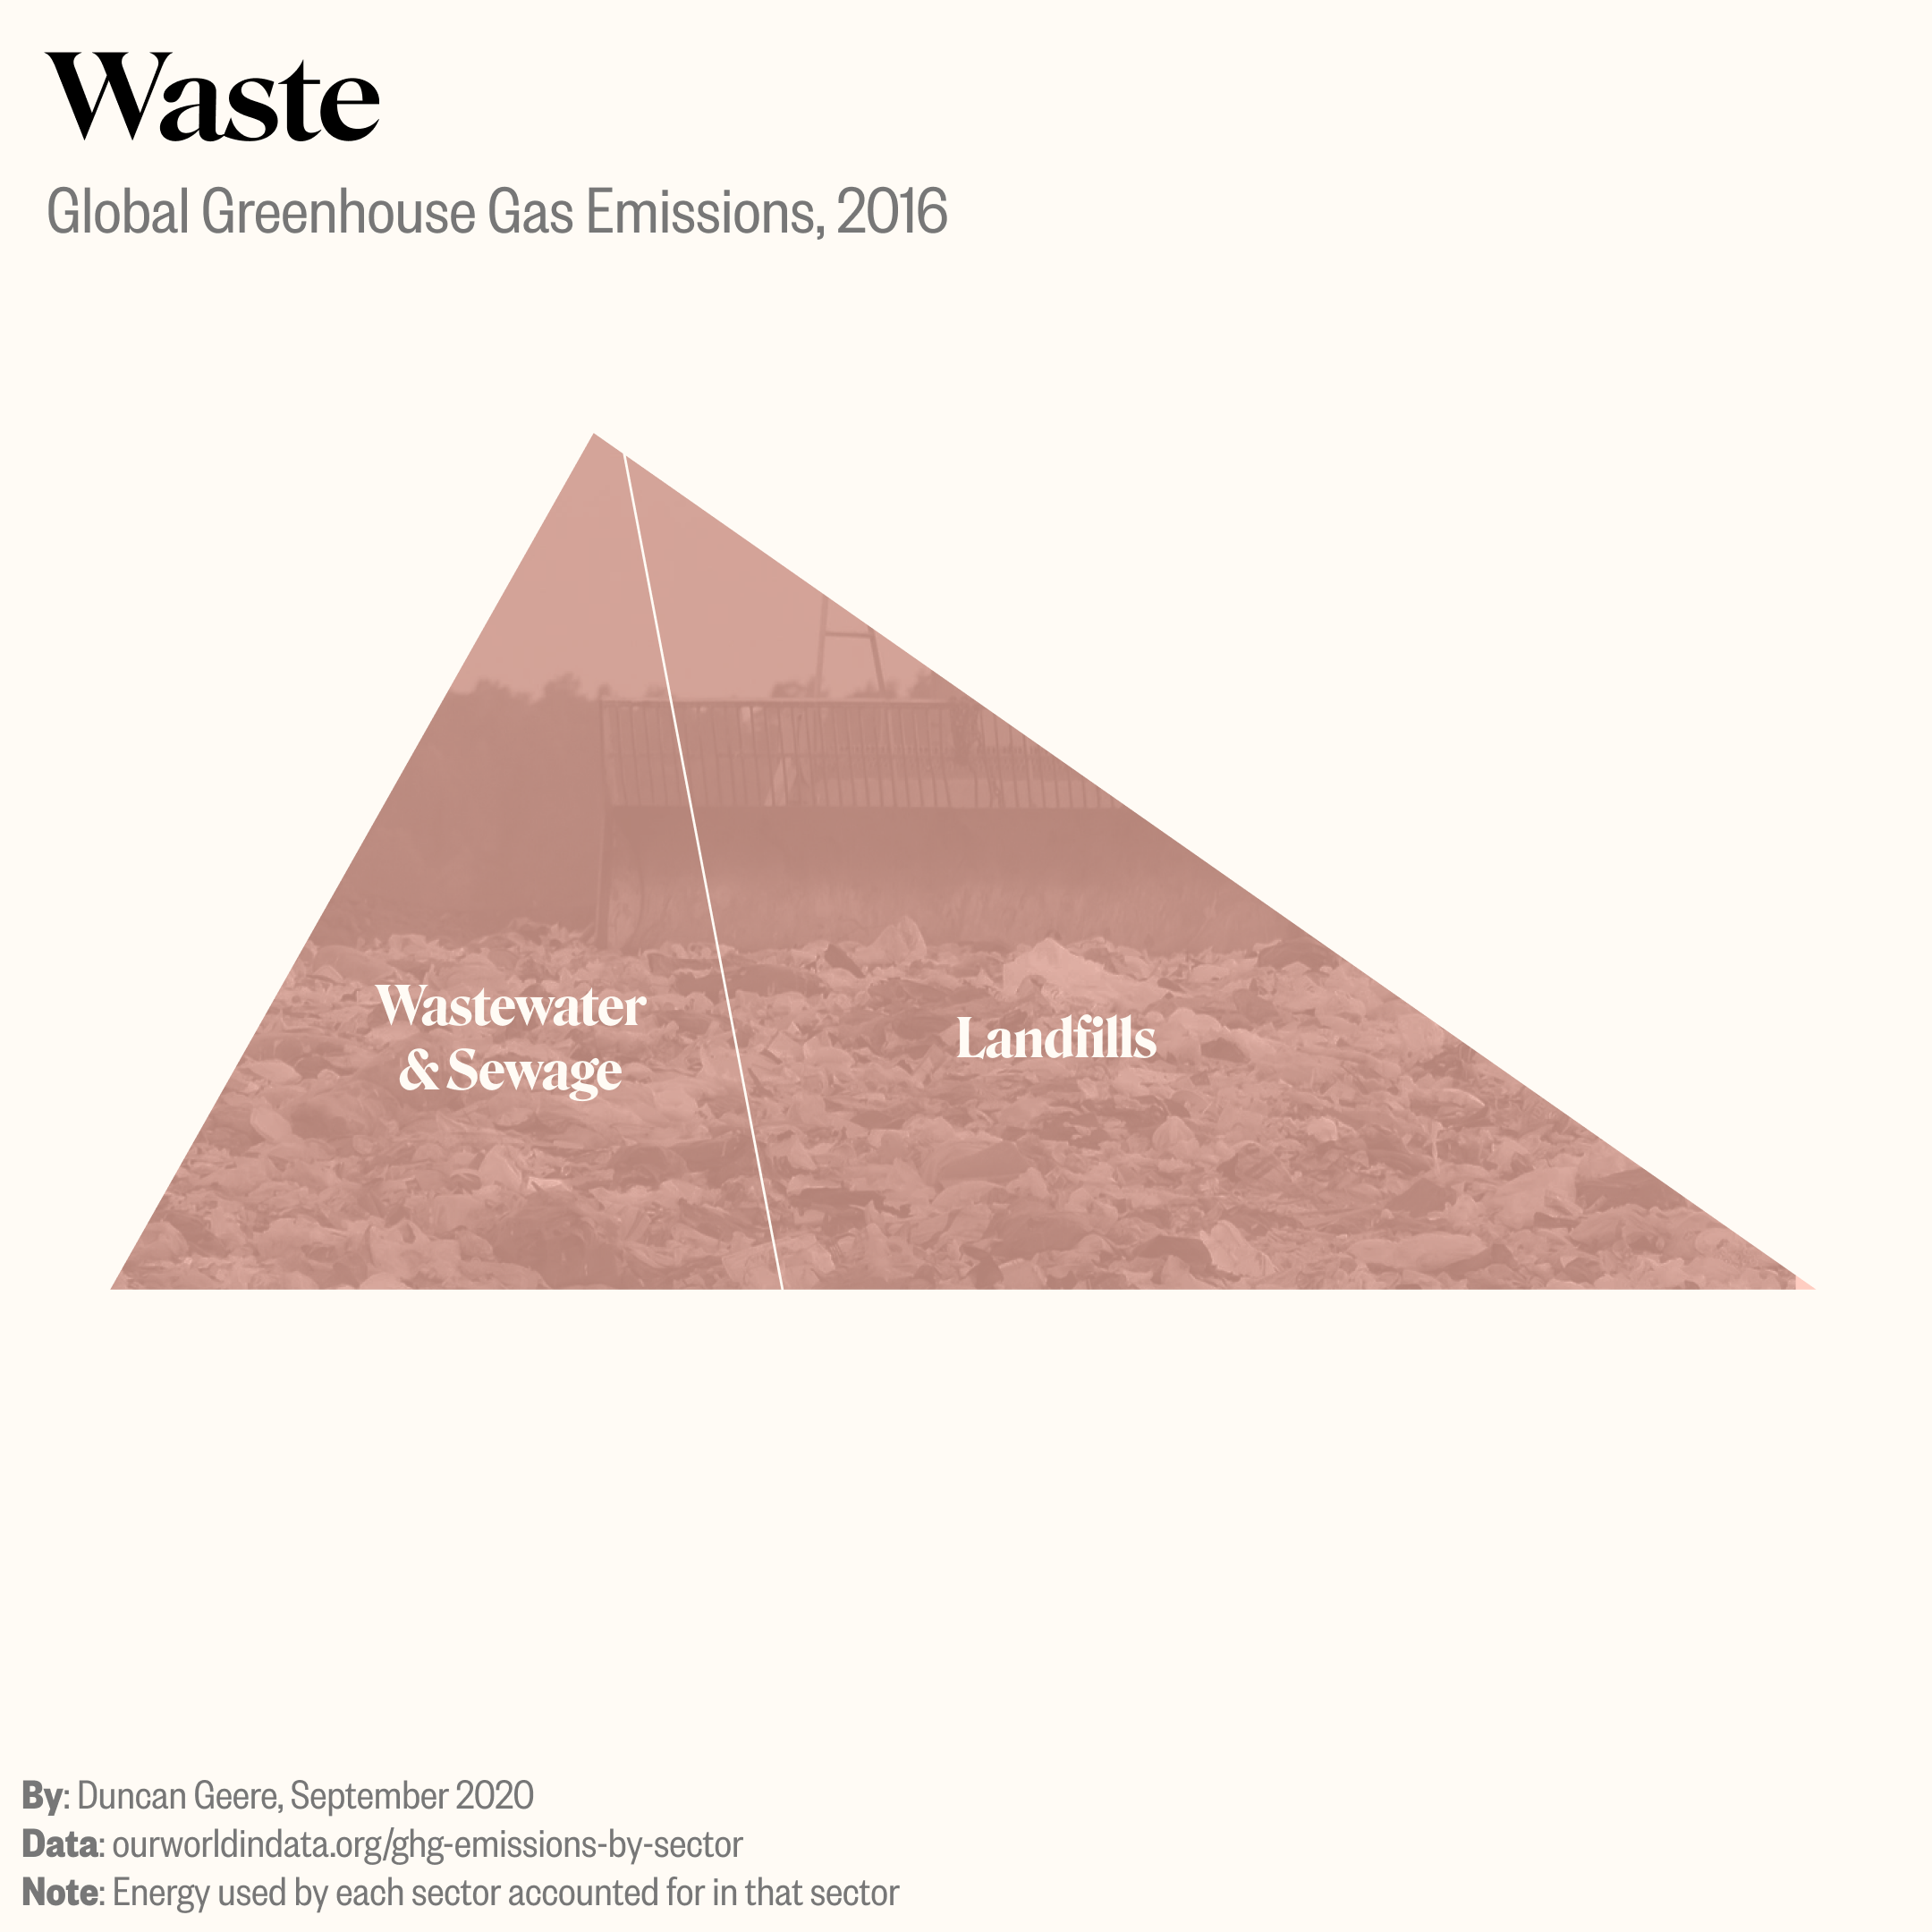
Waste produces a lot of methane - which is a powerful greenhouse gas. We need to get better at capturing it, because it's a useful fuel in its own right. "Natural gas" is mostly just methane, with a PR-friendly name.
The obvious next question is "What can I do?". Here are the most impactful actions you can take, as calculated by Seth Wynes and Kimberley Nicholas.
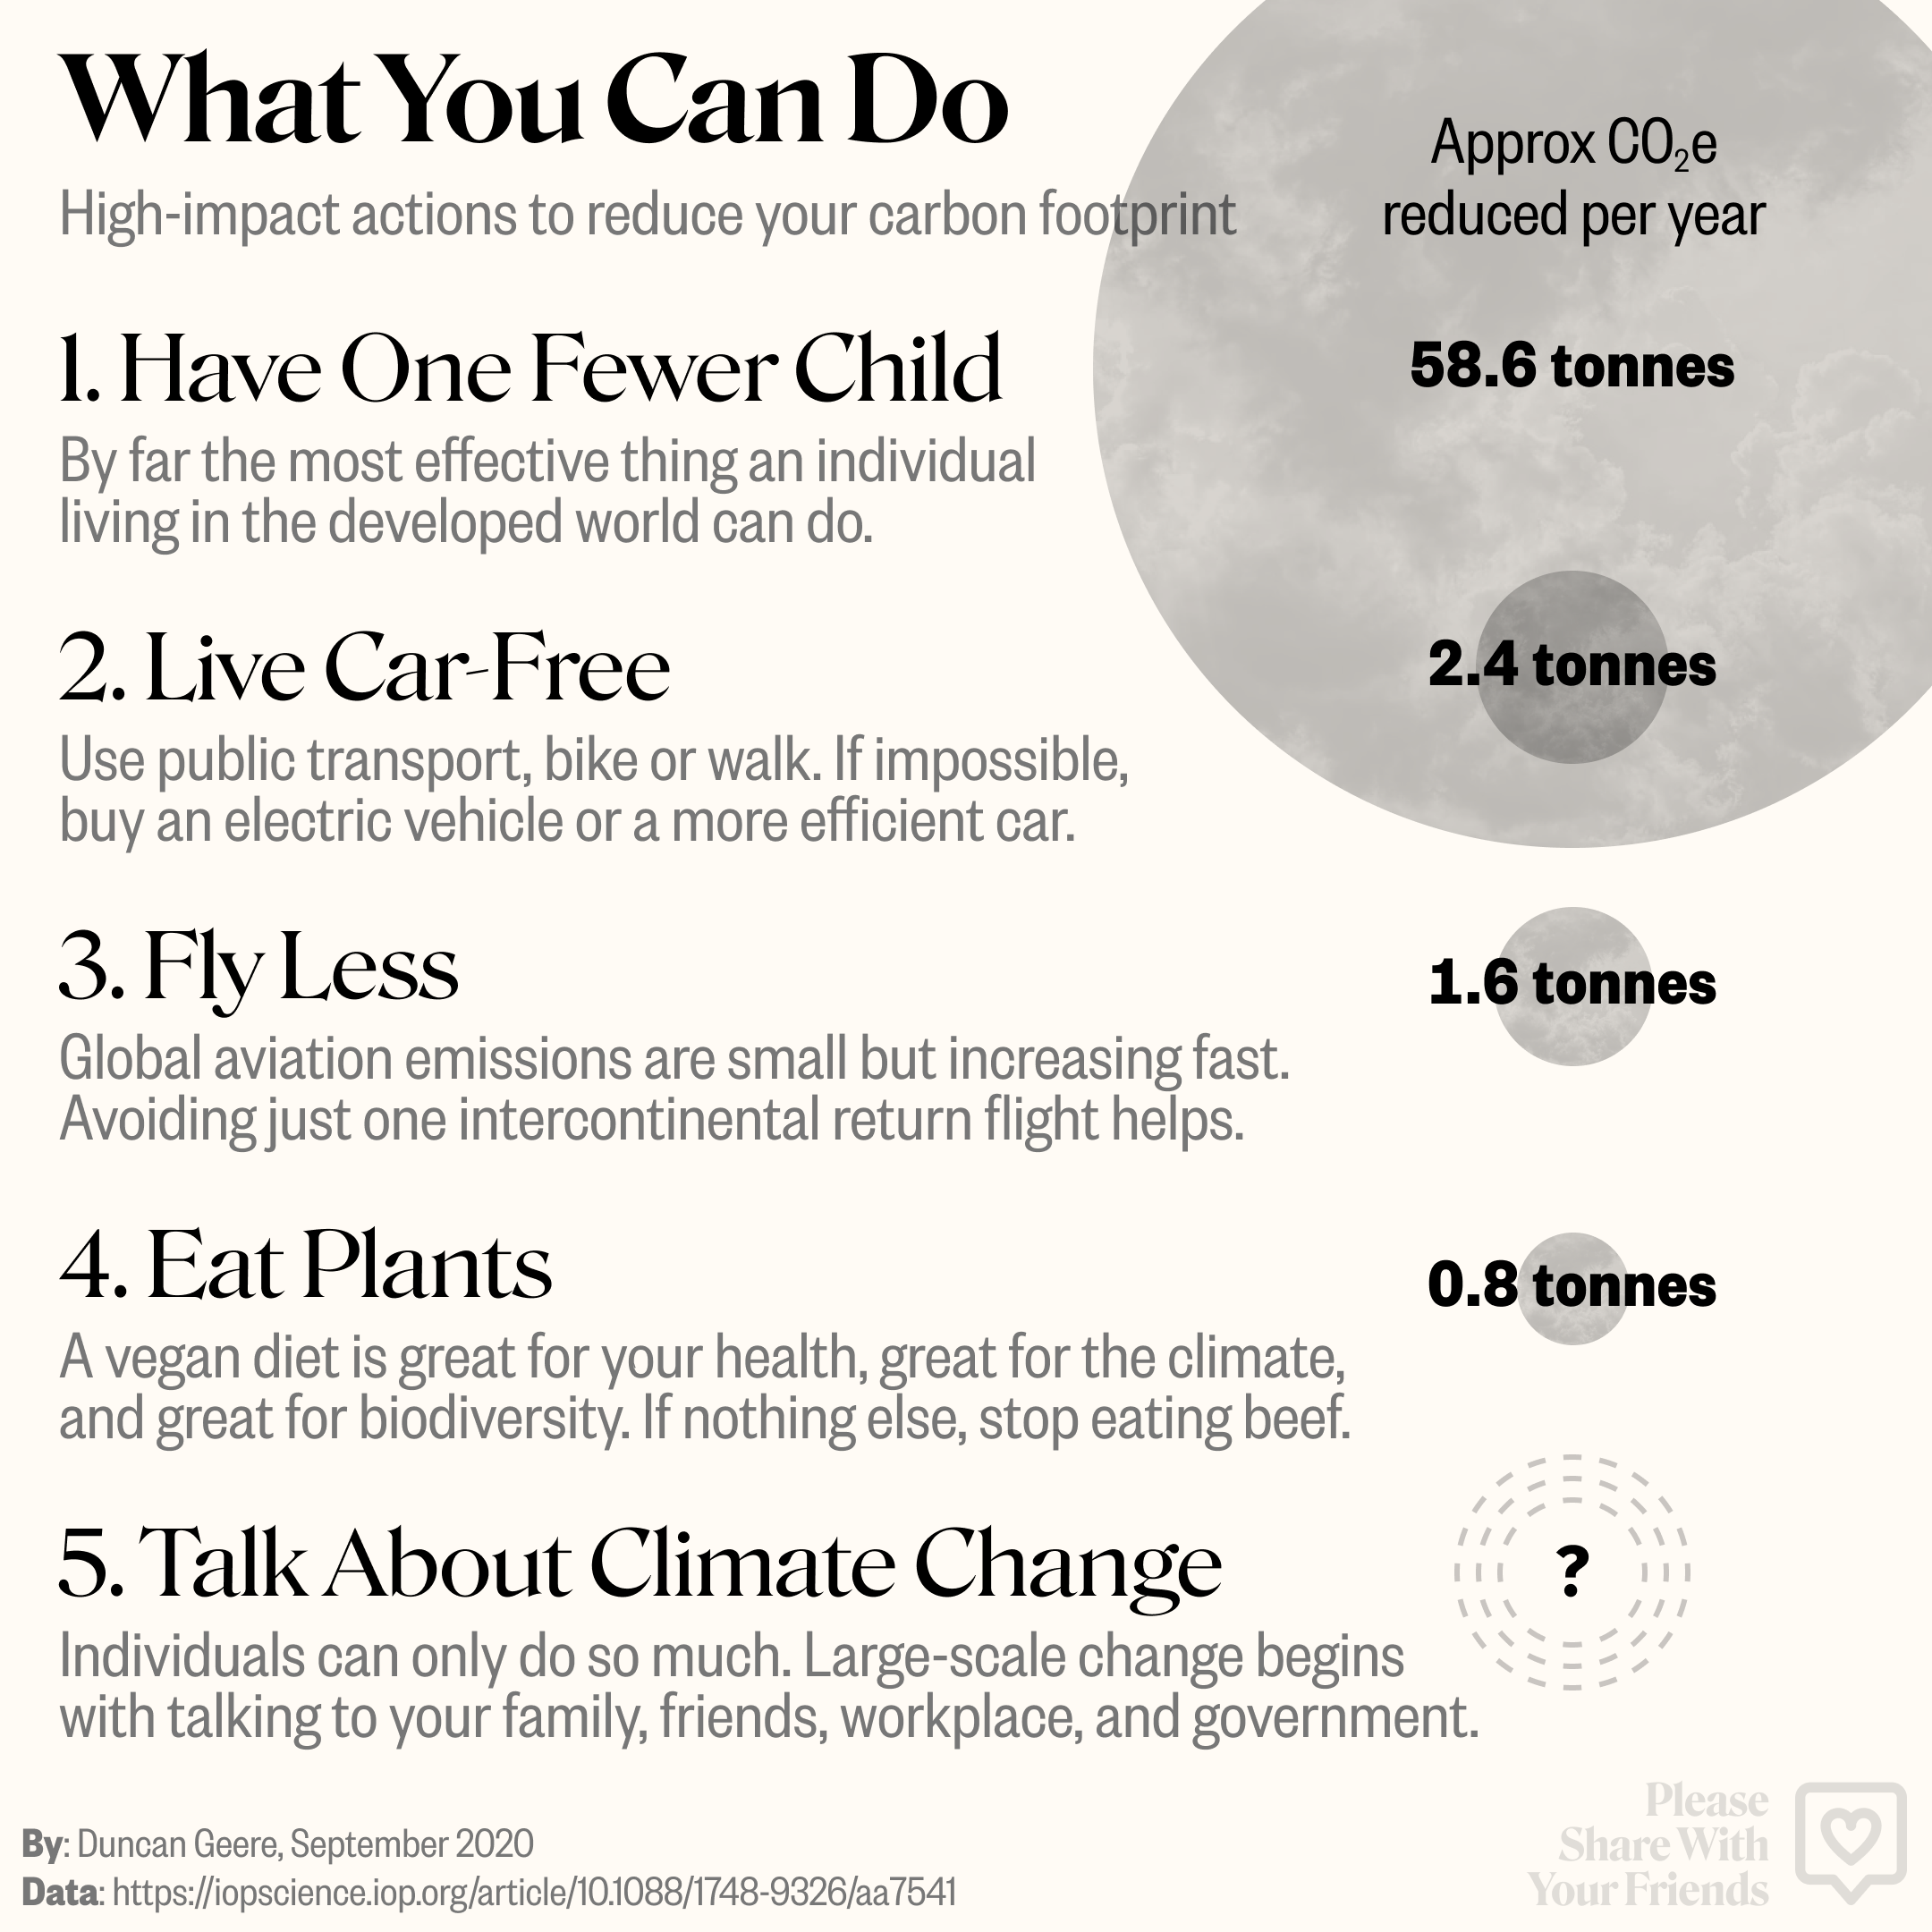
The truth is, though, that larger systemic change is needed to solve this. So talk about it. To everyone. That's the only way we'll get there.