
Make Your Own Data Glyphs With Joyful Data

The folks at Gramener's Storylabs have built a "happy little tool" built on JOY.JS that allows you to create your own system for encoding data in glyphs. It's called Joyful Data.
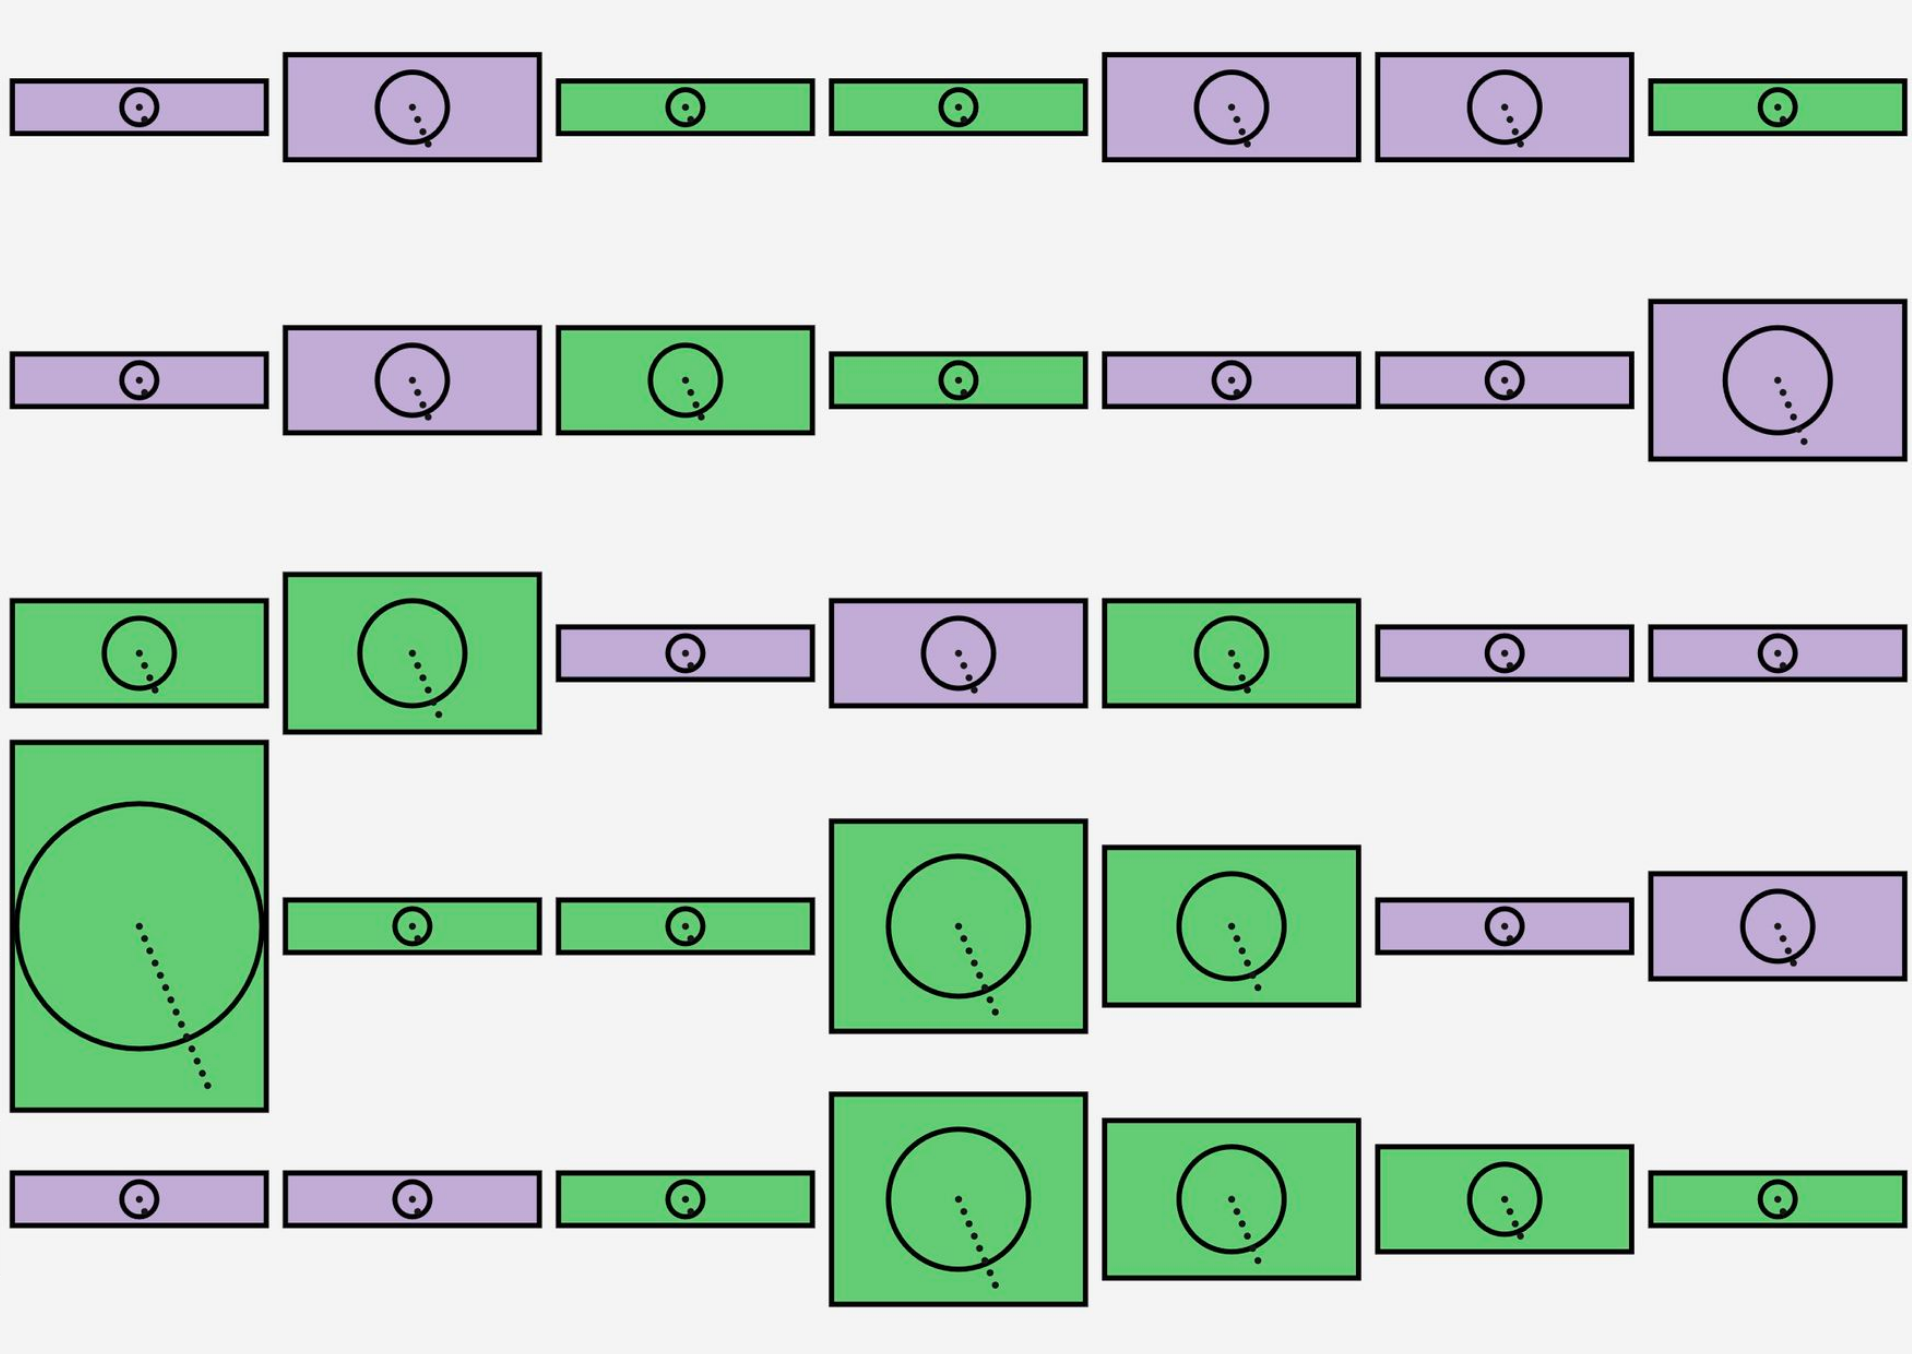
To work with it, you'll need data in JSON format. That's not super-standard, but you can use this handy tool to convert a CSV to JSON. I pulled in some of my data on space dogs to test it out, hosting it on a Gist on Github. I made this super-simple graphic in about five minutes:
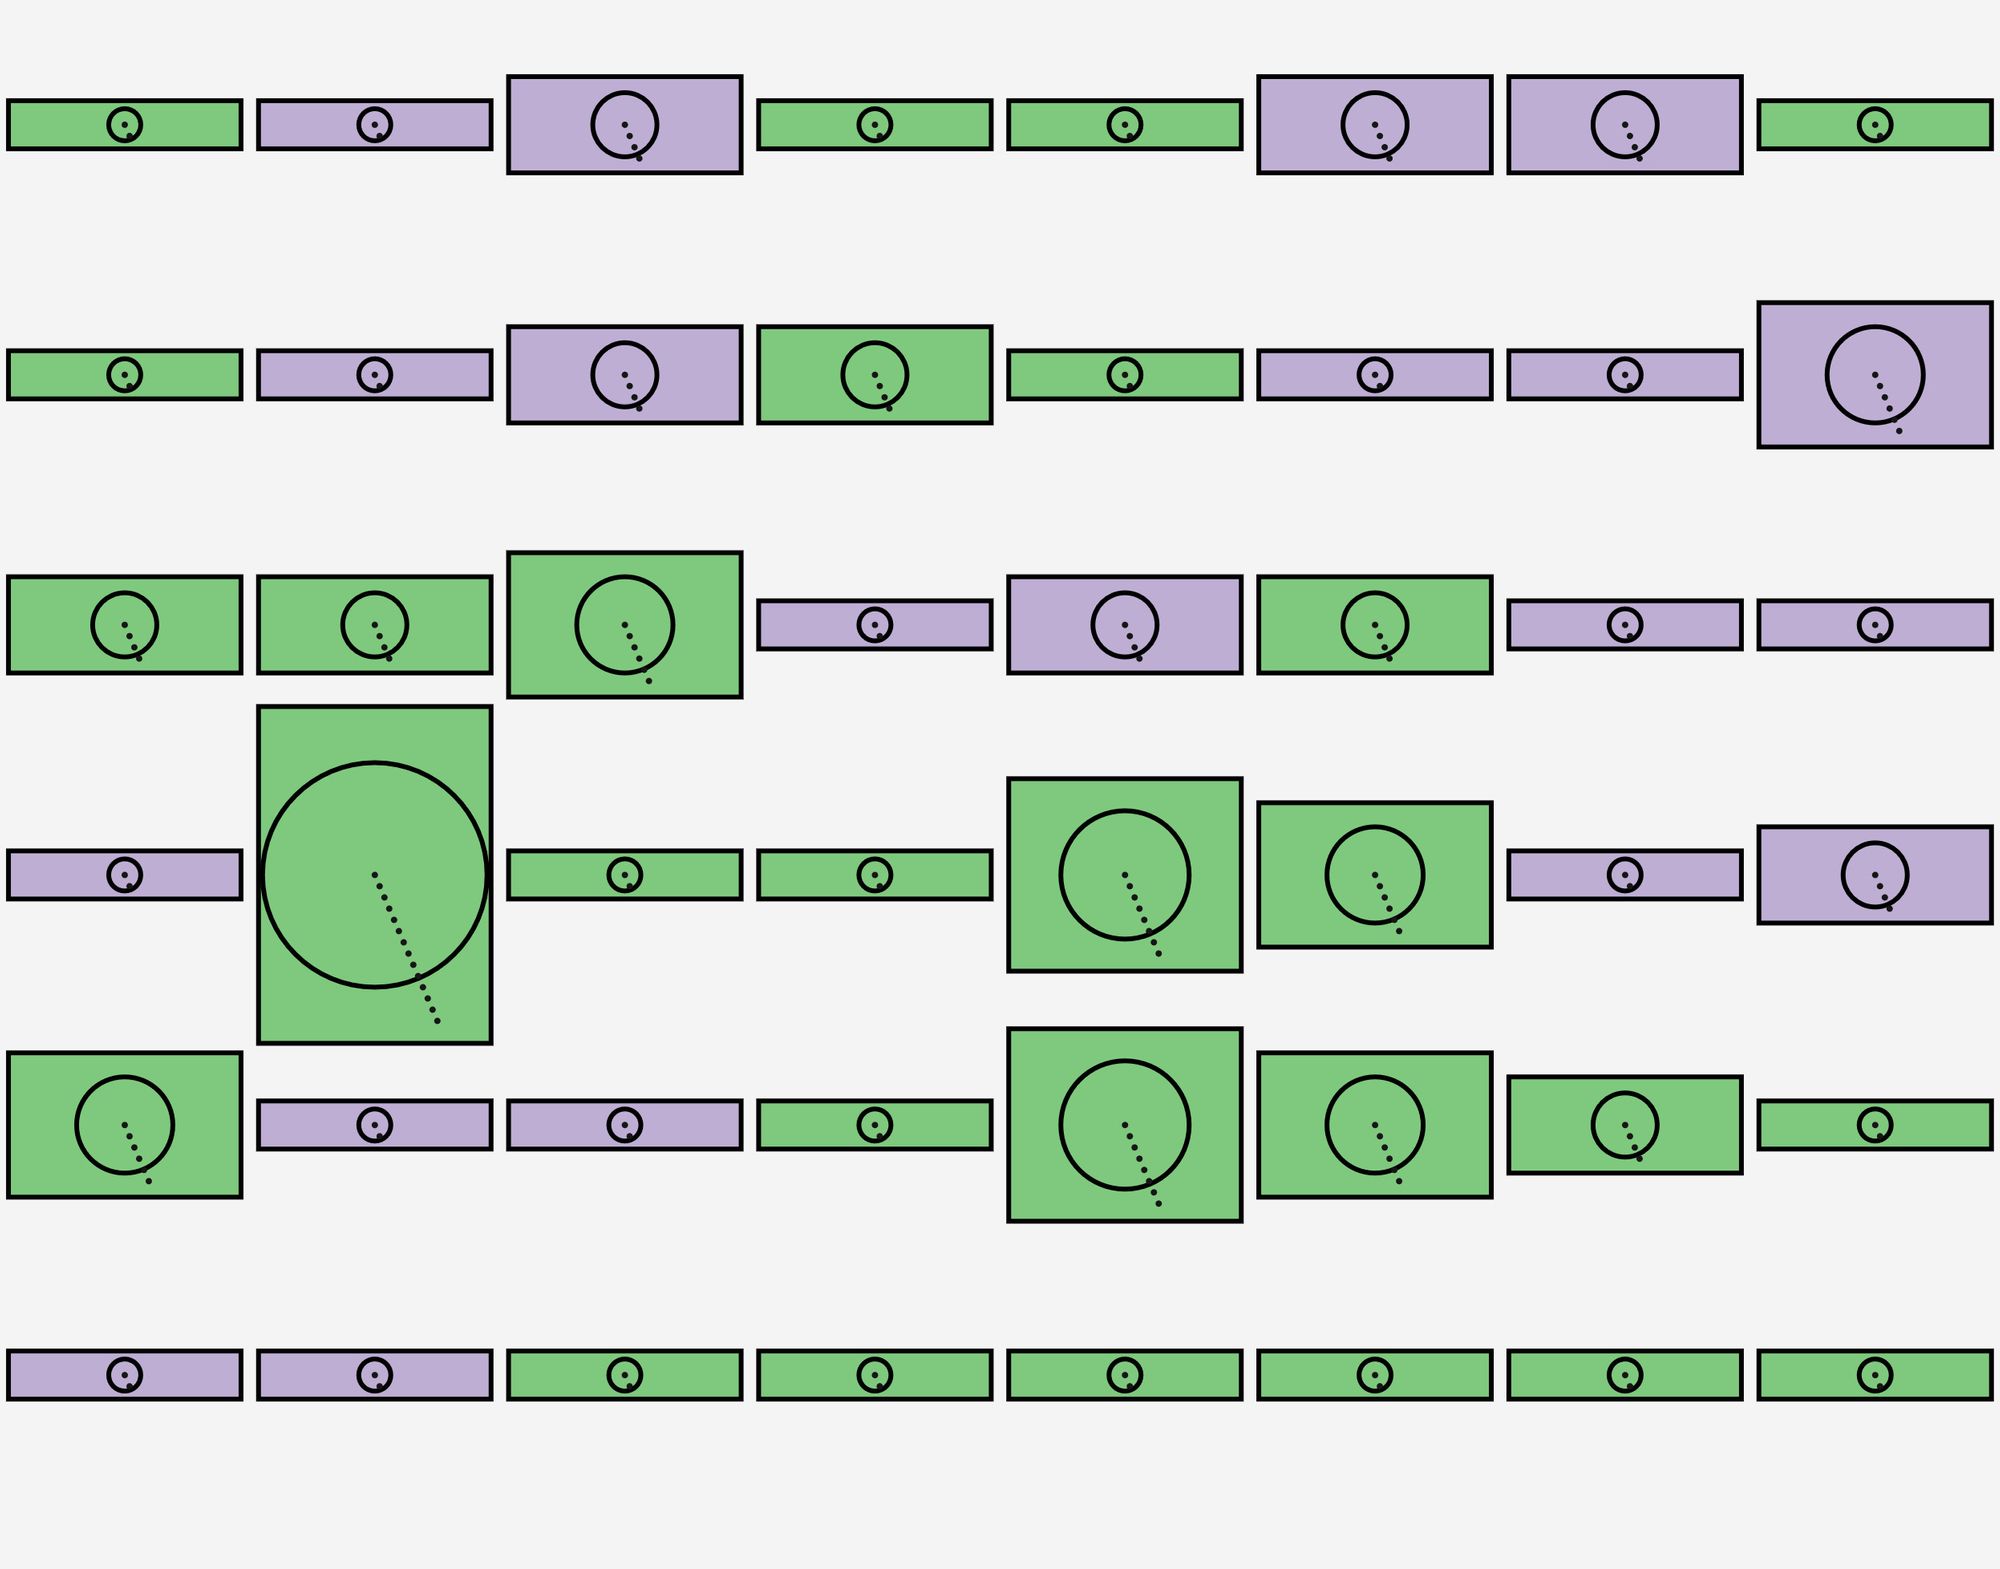
You can see the steps I used to create it here. Each dog is a box with a circle in, and those boxes are sized and have a row of dots that correspond to the number of spaceflights the dog went on. Each is coloured by their fate - green dogs survived, purple ones died in the line of duty.
A few tips that I gleaned from working with this a bit:
- I recommend putting a extra value of 1 in each row of the data, so you can use it as a basis. Without doing that, you can't manually set the size of a shape to be consistent across glyphs (as far as I can tell).
- It works best with numerical data. My data was more categorical, so didn't work quite as well. If you've got lots of numbers, you'll have an easier time.
- Plan out in advance what order you want things to appear in - maybe with some pen and paper sketches. It's not a super-great sketching tool (at the moment).
And a few feature requests that I'd like to see.
- CSV import, and not needing to host the data externally.
- Drag-drop commands into a different order.
- More layout settings.
- Different stroke styles.
- Use [number]s as [var]s.
- Hex code input for colours.
- Colour theme editing.
- SVG export.
Give it a go yourself, and send me pictures of anything you create!