
Month Notes - January 2023


Every ten days or so (a month in this case!), I share a digest of what I've been working on and reading. Here's the latest. More in the series here.
Biggest news of the month is that we're making the Elevate Dataviz Learning Community more financially accessible for more people by dropping the monthly subscription fee from $50 to $10.
After a year of running Elevate, and talking to our members, we've learnt that the part they value most is the community - and so we're doubling down on growing that community, and putting less of a focus on churning out regular blog posts.
Here's what you'll now get for $10/month:
- Access to our vibrant and amazing Slack community. Post questions and get quick help and feedback, share tools or inspiration, or just start a discussion on something you’d like to hear more about.
- Office hours every two weeks - Face-to-face time with the four co-founders of Elevate - myself, Will Chase, Gabriele Merite and Alli Torban.
- Access to our blog archive - this includes challenges, freelance tips and resources, financial reviews, portfolio feedback, and lots more.
- New blog posts when we've got something to say. Updating of old blog posts as things change.
- Access to watch The Elevate Show live, and ask questions for us to tackle.
- Steep discounts on our new courses and tutorials.
If you'd like to grow your creative dataviz skills in a friendly, welcoming community, then now is a great time to join Elevate. Go sign up.
 0
0
For about six months, I've been working in the background on rebuilding the Loud Numbers website to reflect the fact that we're now a full-fledged sonification studio and not just a podcast. So it gives me great pleasure to announce that the new site is now live! Go check it out.
 0
0
The podcast is still there, but the site now also includes documentation of some of the work we've done over the last couple of years, an explanation of what sonification is, why it's useful, and how much it costs, details of our talks and articles, community initiatives, workshops, and even some serious and silly photos of us.
We're currently booking up projects for 2023, so if you've got a dataset that you'd like to hear turned into sound or music then drop us a line.
Relatedly, the sonification Discord community that I help to run, Decibels, continues to go from strength to strength. We now have 91 members, a monthly challenge, a member directory, a knowledgebase, a monthly show-and-tell meetup, and we're planning more.

Some of my recent thinking on how to grow the community further has been informed by Seb Chan's writings on the 1990s Sydney rave scene. In his latest newsletter he wrote:
Music, fashion and cultural scenes were crossing over and changing and in those still-early Internet days, community radio was an essential element. The importance of weekly club nights and parties for the same networks of people to meet up at, the regular radio shows to hear the latest tunes, and then the tentpole big parties which opened the smaller networks up to cross-fertilisation (and new people) cannot be underestimated.
We have our Discord group in place of community radio, a monthly meetup for the regulars, and I'm trying to figure out what the equivalent of "tentpole big parties" to get new people into the community would be. Maybe some sort of online exhibition/event/festival? My thoughts are still developing here. If you're someone who isn't making sonifications, I'd love to what kind of online event would attract you to go check some out.
On the subject of sonification, I suffer from occasional migraines, and as part of my Jamuary musical sketching I recorded a sonification of all the the migraines I had in 2022. The length of the track represents the year, and each, er, “clang” represents a migraine hitting at that point in the year. You can listen over on Bandcamp.
 Bandcamp New & Notable Jan 28, 2023
Here's to fewer clangs in 2023.
The custom Eurorack case that I ordered for sonification work has finally arrived, and to celebrate I've written up a blog post about the best way I've found to do sonification with Eurorack, and what other approaches are available.
 Duncan Geere
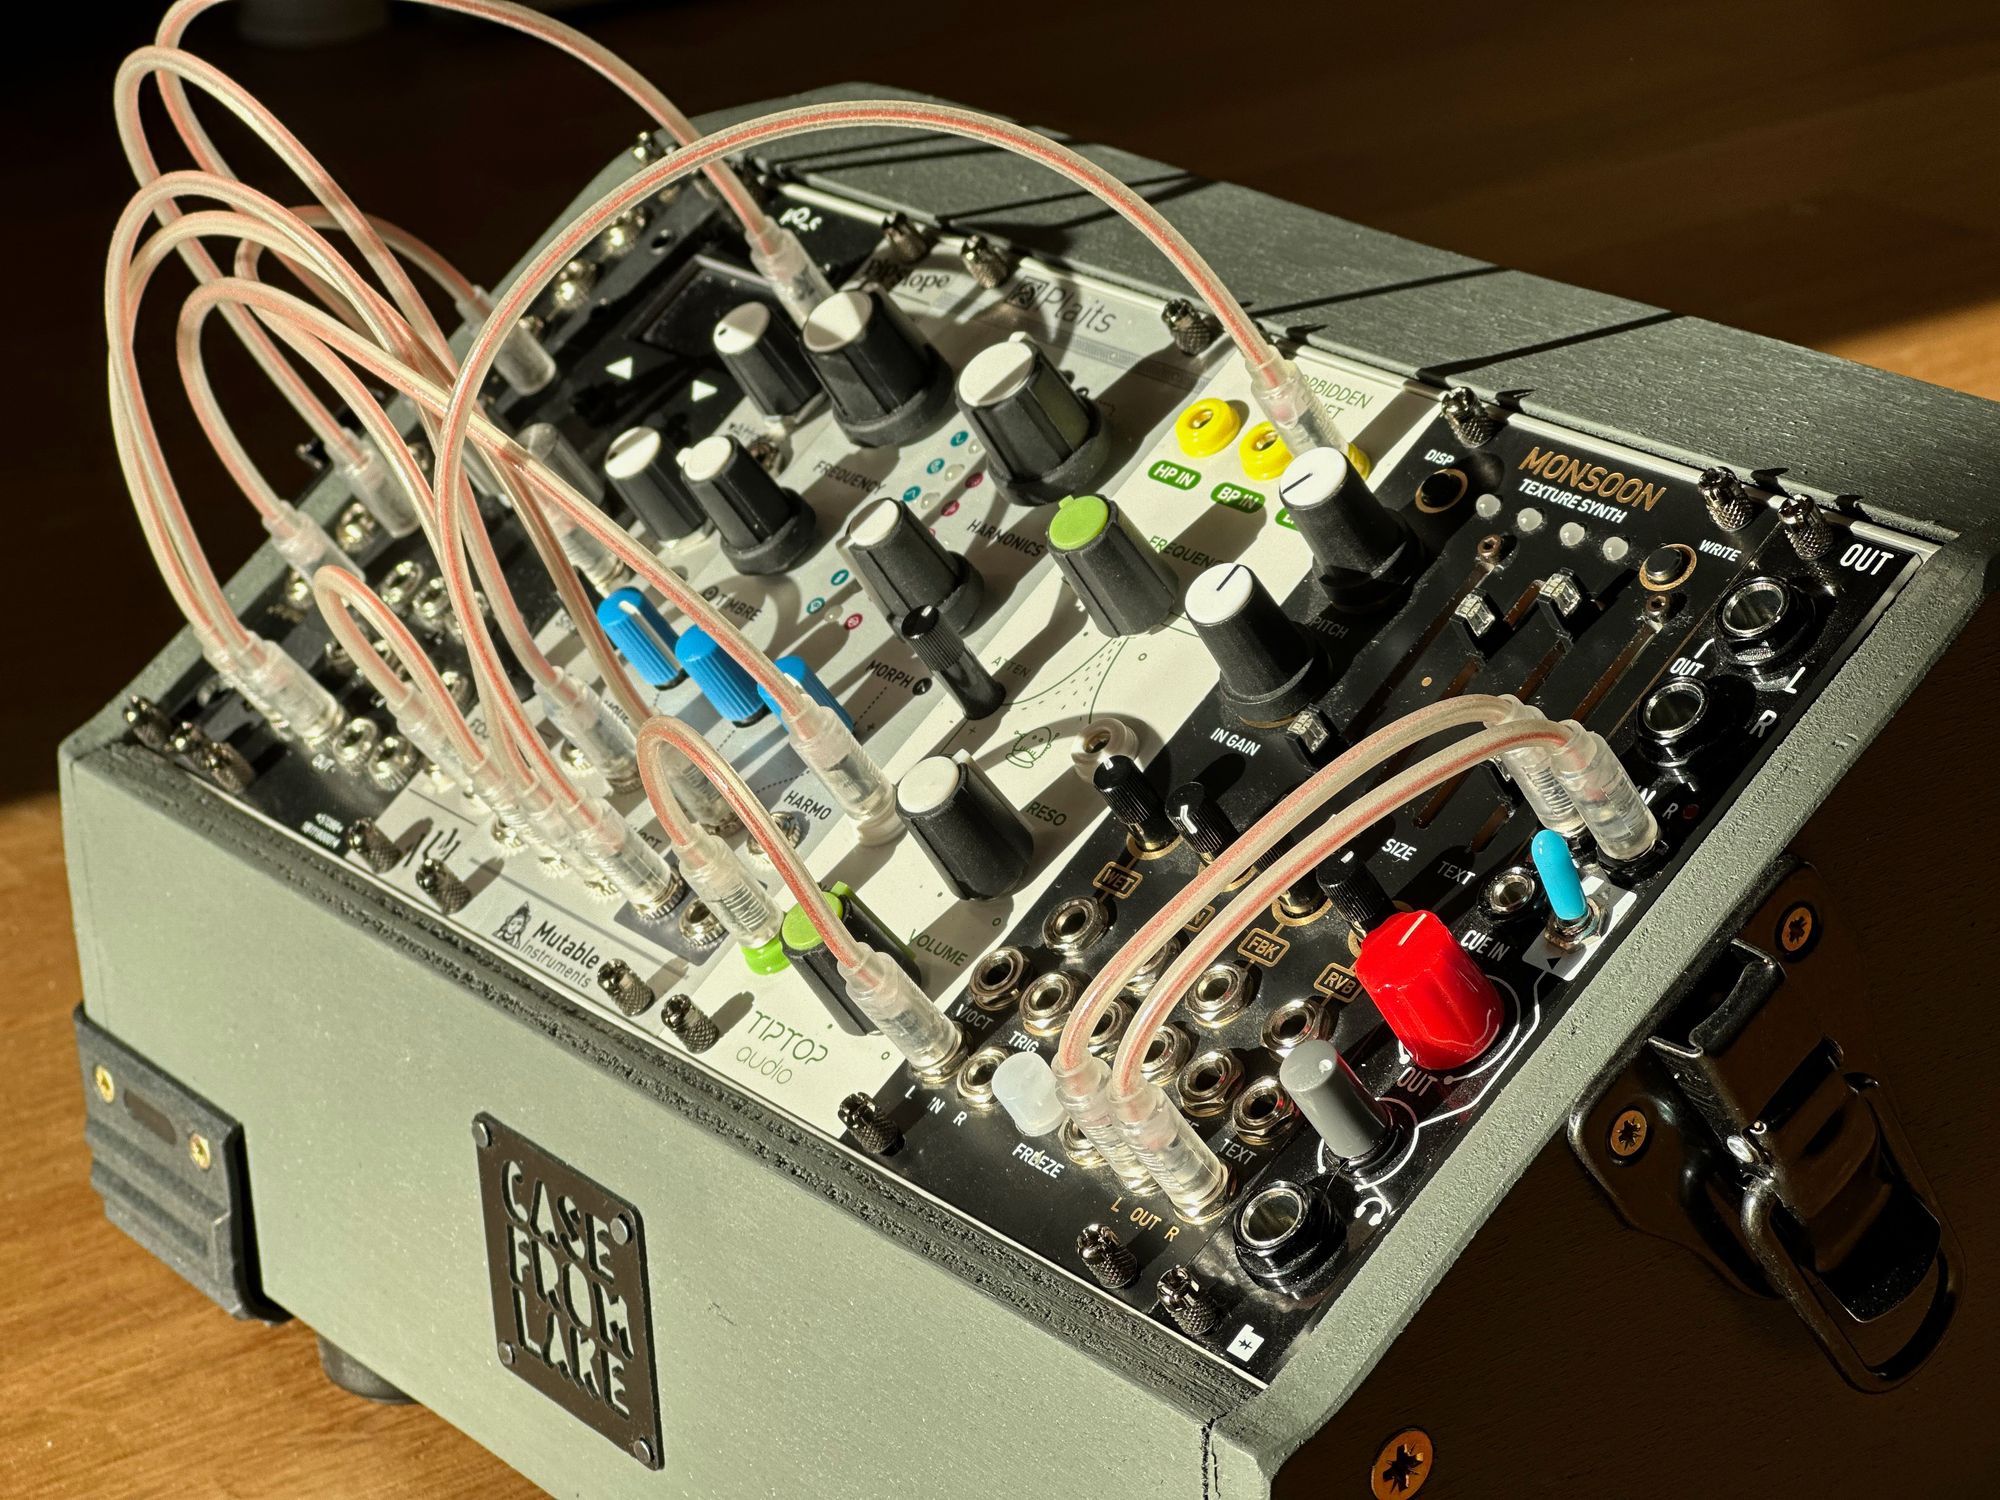
Forewarning: if you're not in the Eurorack world already then here be jargons. But there are some pretty pictures of the cute lil case that I think anyone can appreciate.
Episode four of Signal Chain is out - my creative collaboration with photographer Oliver Holms. We’re taking turns to send new work to each other, with each new piece inspired by the piece before - building a chain of photographic and musical influence. This one's particularly nice, I think, with icy cello sounds inspired by a photo of two trees on Hampstead Heath.
The fine folks at Infogr8 invited me to write a post for their blog, so I put together some thoughts on centring the reader - a key part of the information design process. Here's the intro:
Imagine two examples of data storytelling. Both are about people struggling to feed their families in a place that is known to be relatively prosperous. Both are well-written, compelling, and full of real human voices. Both are backed by robust data analysis, as well as attractive, insightful visualisations of that data. The only difference between the two stories is that one is set in a neighbourhood on the other side of the world, and the other is set in the neighbourhood where you live. Which are you most likely to click on?
You can read the full thing, complete with examples from some of my work at the climate charity Possible, right here.
 Infogr8
Speaking of Possible, I designed and did the dataviz for the biggest ever study of the impact of the UK's weirdly divisive Low-Traffic
Neighbourhoods. Despite the endless debate over their effectiveness, it turns out that most streets within low traffic neighbourhoods see reductions in traffic, improving the experience of walking and cycling. Across London the average traffic reduction within LTNs was 46.9%.
 Russell Warfield
What’s more, there is little indication of this traffic being simply displaced onto boundary roads. Average motor traffic counts showed that on boundary roads, traffic changed relatively little - with a less than 1% increase on the mean average of 11,000 vehicles that pass through boundary roads on a typical day.
The research was covered in the Guardian, the BBC, Forbes and more, and shared by London mayor Sadiq Khan and broadcaster Jeremy Vine.
If you're in the UK, and you want an LTN where you live, we've put together a handy tool where you can email your local councillors to ask for one. From your postcode, the tool figures out who your councillors are, and then pre-fills an email with all the arguments you need to make your case. You can edit it however you like, and then hit send. Takes two minutes. Give it a try!
After many years of buying and playing and storing and eventually giving away boardgames, I think I have settled on the only one I'll ever need for the rest of my life.
Spirit Island is a 1-6 player settler-destruction co-op game that, for me, is the perfect blend of accessibility and depth. I've been playing it for... what... three years now? And honestly I feel like I could play it for ten more. The theme, mechanics and the tight connection between the two make it a real joy. It's great solo, it's great with two players, it's a little slow but still fantastic with four (or even six with expansions)
Why am I writing about it now, given I've been loving it for three years? Well, while I own the physical game and all the expansions, I've been spending more time lately with the Steam version. It doesn't have all of the expansions of the physical game, but automates so much of the placement mechanics that it makes it a total joy to just throw 20 minutes into, here or there. I've also been playing a lot of the slightly-less-automated Tabletop Simulator version (which does have the expansions), playing with a friend back in Gothenburg.
So consider this a recommendation for whatever format you like best - Steam/Mobile, Tabletop Simulator, or the original physical game. And if you're relatively new to more complex boardgames and/or want to play with kids, then consider the standalone-but-compatible Horizons of Spirit Island instead.
Alright that's enough about me. Here are some bits and bobs that I've found particularly interesting on the web this month.
First, via Matt Webb, an incredible paper titled "Corporate Insecthood" that examines the extent to which we anthropomorphise things - animals, objects, and especially companies. If nothing else, check out the chart on page six that shows how different companies match up to other things in their perceived "person-ness". Teach for America is equivalent to an elephant or "deceased man". Disney is slightly less of a person than a bird. Nike is about the same level as a microbe, while Pfizer is equivalent a houseplant.
Second, a guide to saying no to all kinds of things - from meetings, to phone calls, to a second date, to a pushy salesperson. You can even load the responses into Gmail as templates. My favourite is "how to say no after you already said yes".
Third! An interactive guide and training tool for learning how to find compass directions based on the time of day and position of the sun in the sky. It's tricky, but with a bit of practice you'll get there.
Fourth, via Andrew Dana Hudson, a definition of "cultural fracking":
The capitalist process of endlessly extracting new value out of the sedimentary layers of meaning that comprise mass culture from the past.
There's an extended writeup of the idea in the Canadian Media Fund’s 2023 Trends Report. One could argue the "cultural fracking" is part of the DNA of the extraction of new value from imagery posted to the web by Dall-E, Midjourney, etc, too.
Fifth and finally, a little nugget from Oliver Burkeman's "The Art of Imperfection" workshop that I attended earlier this month - a blog post from Susan Piver titled "Getting stuff done by not being mean to yourself". If that's not the perfect goal for 2023, I'm not sure what is.
I'm going back to the normal newsletter schedule again now, so see you again in 10 days!
- Duncan