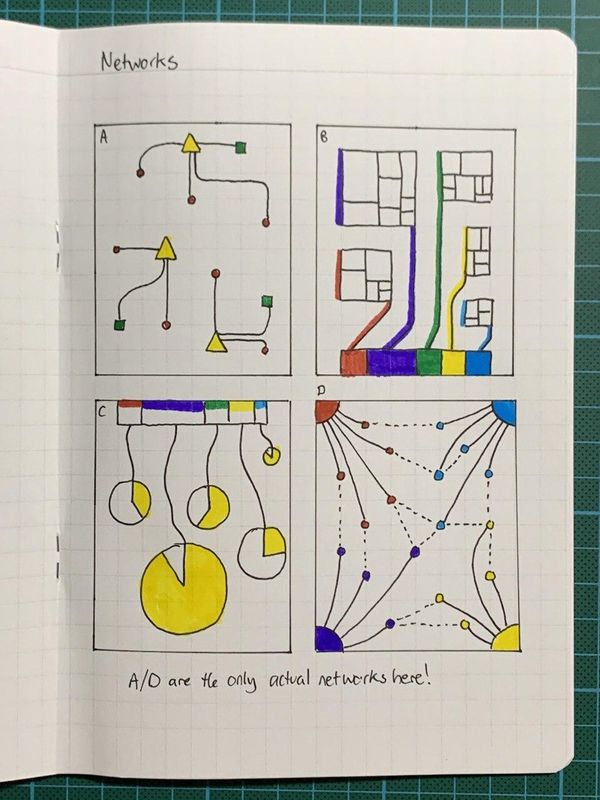
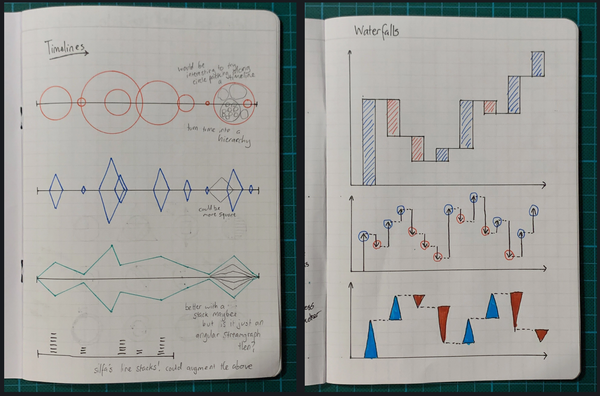
Back to charts for my latest set of sketchbook pages. Lexis diagrams
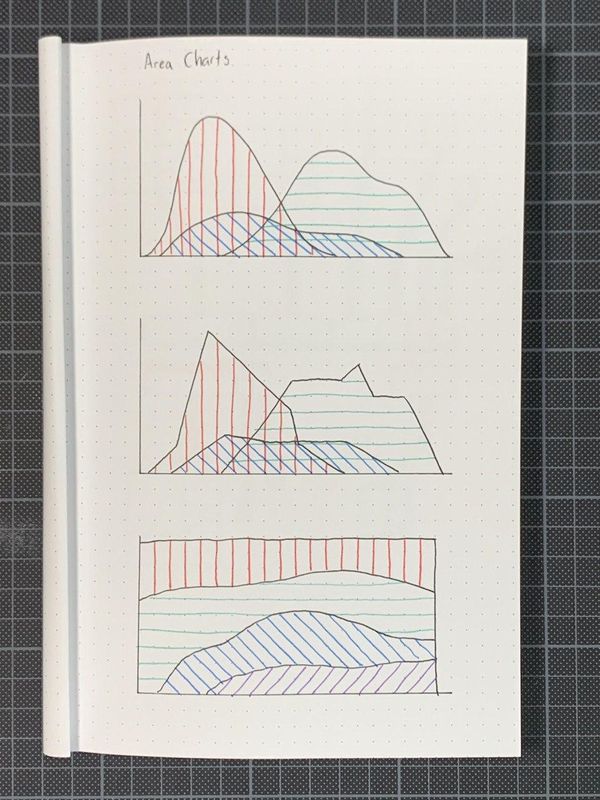
[https://en.wikipedia.org/wiki/Lexis_diagram], area charts, a xenographic
[https://xeno.graphics/] concept called treemap bars that I really like for
hierarchical data, and some new approaches on stacked bars. Enjoy!