
Tenday Notes 21 Aug - 31 Aug 2021

Every ten days I share a quick digest of what I've been working on. Here's the latest. More in the series here. Want them in your inbox? Sign up.
First thing to say this time is that I soft-launched my previously-mentioned data visualization membership programme with Alli Torban, Will Chase and Gabrielle Merite yesterday. If you wanted to be a part of the beta, and you filled out our survey, then you should have an email in your inbox telling you how to sign up. If you don't, or you wanted to join but missed the boat before, then drop me an email and I'll sort you out.
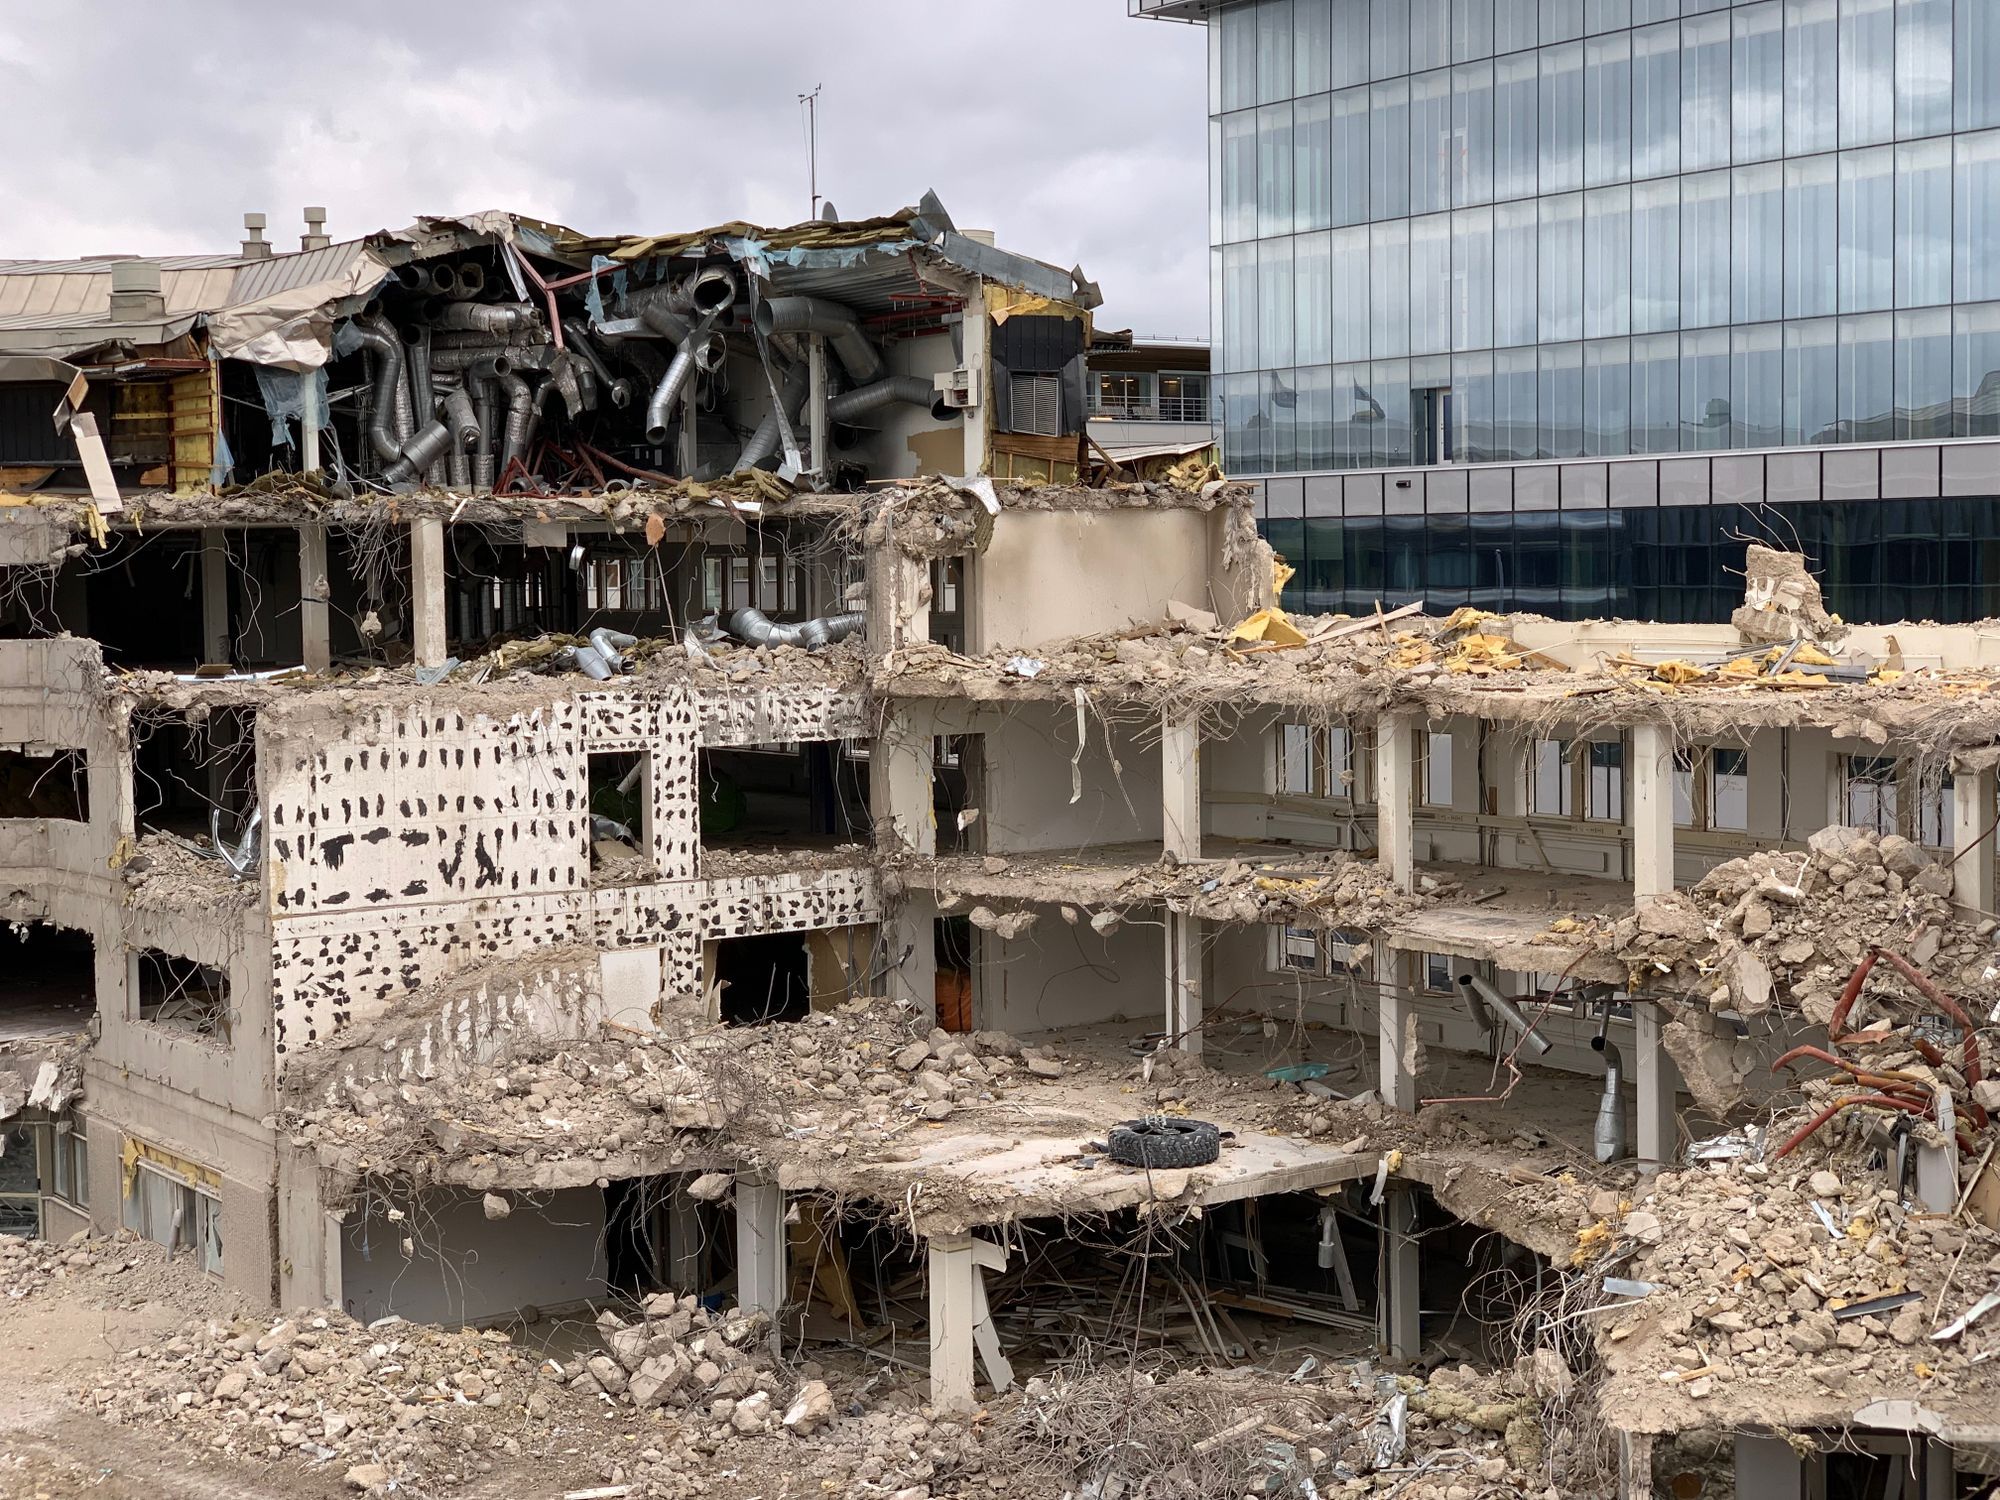
I'm settling into Helsingborg nicely. I've done a few weeks of work now, and the new studio setup feels like a huge upgrade on my previous working arrangement - lots of space, lots of light, big table, nice high ceiling. It's remarkable what a difference that makes in terms of spurring creativity.
Helsingborg itself is becoming more familiar to us, too. There's still plenty of summery things happening, though schools went back in Skåne a week or so ago so there's the "start of term" feeling too. We found an amazing vegan Vietnamese place, and a wonderful south Indian place, so we're sorted for takeaways, which is nice.
The most surprising difference between Göteborg and Helsingborg that I've noted so far is actually the quality of e-scooter parking. In Gothenburg, they're all over the pavement. Here in Helsingborg they're gently arranged up close to walls, not blocking the way. A cultural difference? Local legislation? I will endeavour to find out.
Midding (v. intr.):
feeling the tranquil pleasure of being near a gathering but not quite in it—hovering on the perimeter of a campfire, chatting outside a party while others dance inside, resting your head in the backseat of a car listening to your friends chatting up front—feeling blissfully invisible yet still fully included, safe in the knowledge that everyone is together and everyone is okay, with all the thrill of being there without the burden of having to be.
 dictionaryofobscuresorrows
This is a fact that cartographers have known since at least the late 1870s, but no-one knew why until 1976, when the "four colour problem" was finally solved with the help of one of those new-fangled computers. In between those dates, however, attempts to solve the problem helped develop a whole new branch of mathematics (graph theory!).
Chalk one up for colouring in.
(via the excellent Strange Maps blog)
I've been revisiting a lot of early post-rock albums lately, thanks to a collection of essays written by TheLitCritGuy. He's going through the discographies of Mogwai, Godspeed You!, Explosions In The Sky and Sigur Ros and reflecting on how their work has evolved over the years.
If you're familiar with all these bands, you'll really enjoy the writeups. There's a free essay about the first Godspeed You! album, F#/A#/∞, but the rest are behind a small Patreon paywall. It's worth paying for a month to read them.

If you're not familiar, then I'd highly recommend giving F#/A#/∞ a listen on a pair of good headphones. Here's a YouTube link.
I did an interview with the folks at datajournalism.com about Loud Numbers, and they've just published it in both podcast and text form. If you'd like to know a bit more about sonification and how we made Loud Numbers, then I think you'll enjoy it.

My favourite bit is where we talk about the power of sonification compared to visualization. To explain, I said:
"You can create a sonification so that it gets so loud that it hurts. You can never make a bar chart where the bar is so long that it hurts."
I'm also starring in the newest episode of the fantastic Data Viz Today podcast, which is particularly exciting for me because Data Viz Today is the podcast I listened to endlessly when I was first learning data visualization.
Check out our episode and the show notes on the Data Viz Today website.
 Allison Torban
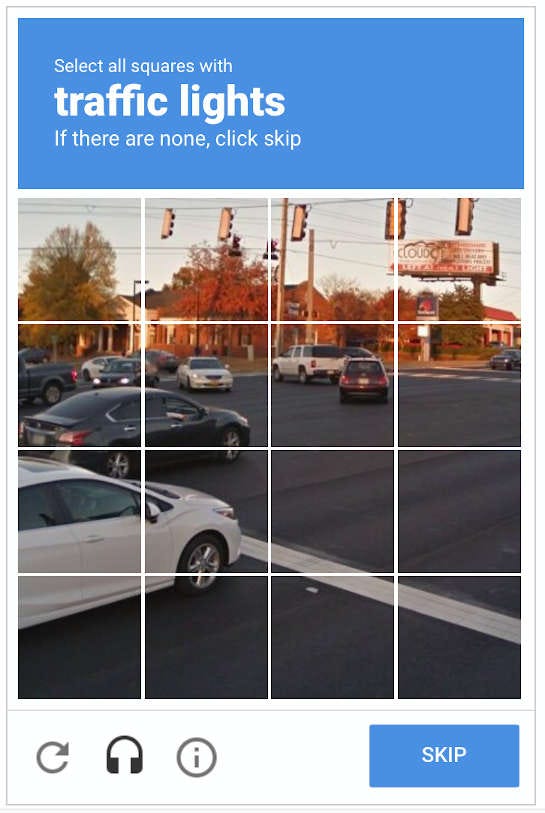
Why Captcha pictures are so unbelievably depressing, by Clive Thompson.
They weren’t taken by humans, and they weren’t taken for humans. They are by AI, for AI. They thus lack any sense of human composition or human audience. They are creations of utterly bloodless industrial logic. Google’s CAPTCHA images demand you to look at the world the way an AI does. It’s no wonder we wind up feeling so numbed and depressed as we click through them, day in and day out.
One of the questions that has occupying me over the last few months is how to do good sonification work with my increasingly-powerful Eurorack modular synth setup, and I think I've found the answer.
It's called Norns Shield, and it's a bit like an open-source Game Boy for weird music stuff. I assembled it myself from a Raspberry Pi and a kit that I ordered from the States. It's tiny, extremely portable, and makes very lovely sounds. What's more, I can write a script for it that'll do sonification.
It actually has its own synth engine onboard, but it also plugs into a Eurorack module called Crow which gives it the ability to input and output at Eurorack levels. This would let me send signals that I could use to control my Eurorack kit - volume, pitch, effects, and more.
So my first project for the time I'm setting aside in November to work on personal stuff will be learning how to write scripts for Norns, and putting together a script that does sonification.
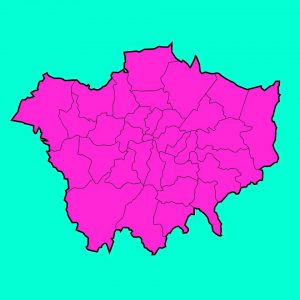
Russel Curtis has done a wonderful analysis of the amount of space taken up by London's golf courses and how much impact it could have on the city's housing crisis if they were developed into acommodation instead.
As of March 2019, there were 178,023 people living in temporary accommodation in London. By reducing London’s public golf courses by just 220 holes (13% of the total), we could reduce the number of people living in temporary accommodation by 57%. This would still leave 1,473 holes available across the city. Perhaps now is the time for a rational discussion about whether golf courses still represent an optimal use of land and whether the councils which own them should consider putting them to a more appropriate use?
 russellcurtis
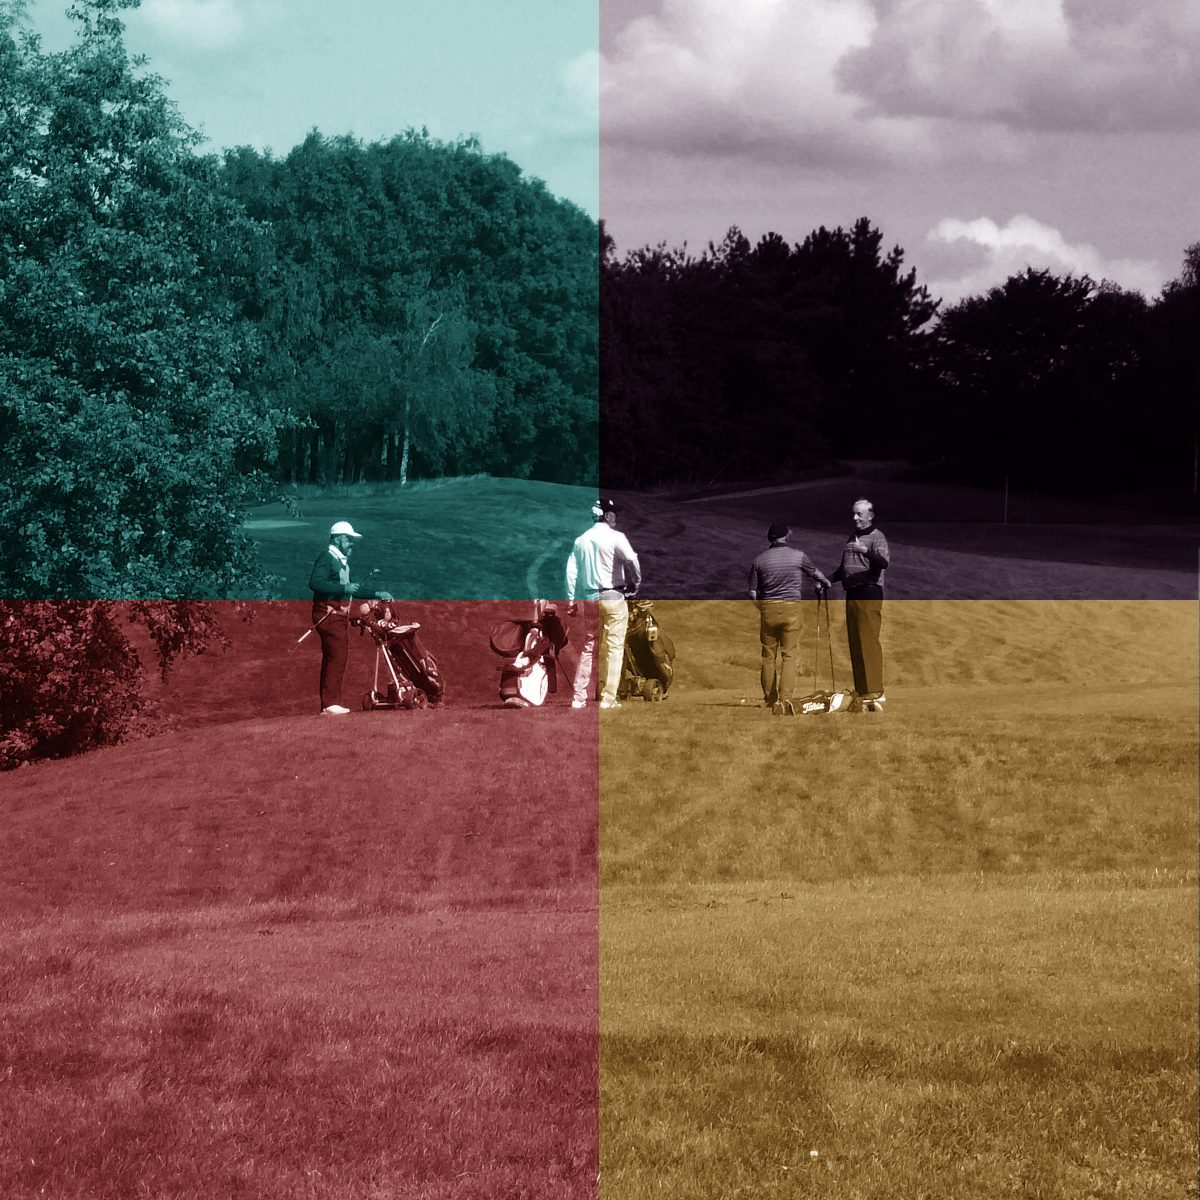
Finally, as a little experiment, I ran some of the climate change charts I've made this year through a neural network called VQGAN + CLIP. It's basically a bunch of code that can take words and make pictures from it based on data the code was trained on.
In this case, it takes my chart and then mangles it based on the words I provided - which in all cases were "a data visualization showing climate change". So the algorithm is essentially trying to make what it thinks is a climate change chart out of my climate change charts.
The results aren't in any way informative, but it is fun to see the mangling in action.
A short thread of climate change charts I've made over the past year which have been weirded by VQGAN CLIP: https://t.co/2oDZwnIb58
— Duncan Geere 🔰 (@duncangeere) August 30, 2021
That's all for this week. See you next time.