
Tenday Notes 21 Mar - 10 Apr 2022

Every ten days or so, I share a quick digest of what I've been working on and reading. Here's the latest. More in the series here.
I've been feeling pretty burnt out lately, which is a consequence of having been fully-booked with work for the best part of six months. That's great for my bank balance, which is always a consideration as a freelancer, but not so great for my mental health. So I've not booked any client work in for April (except for my ongoing commitments - which already account for 50%+ of my time), and I'm focusing on Loud Numbers (my data sonification project) and taking some trips instead.
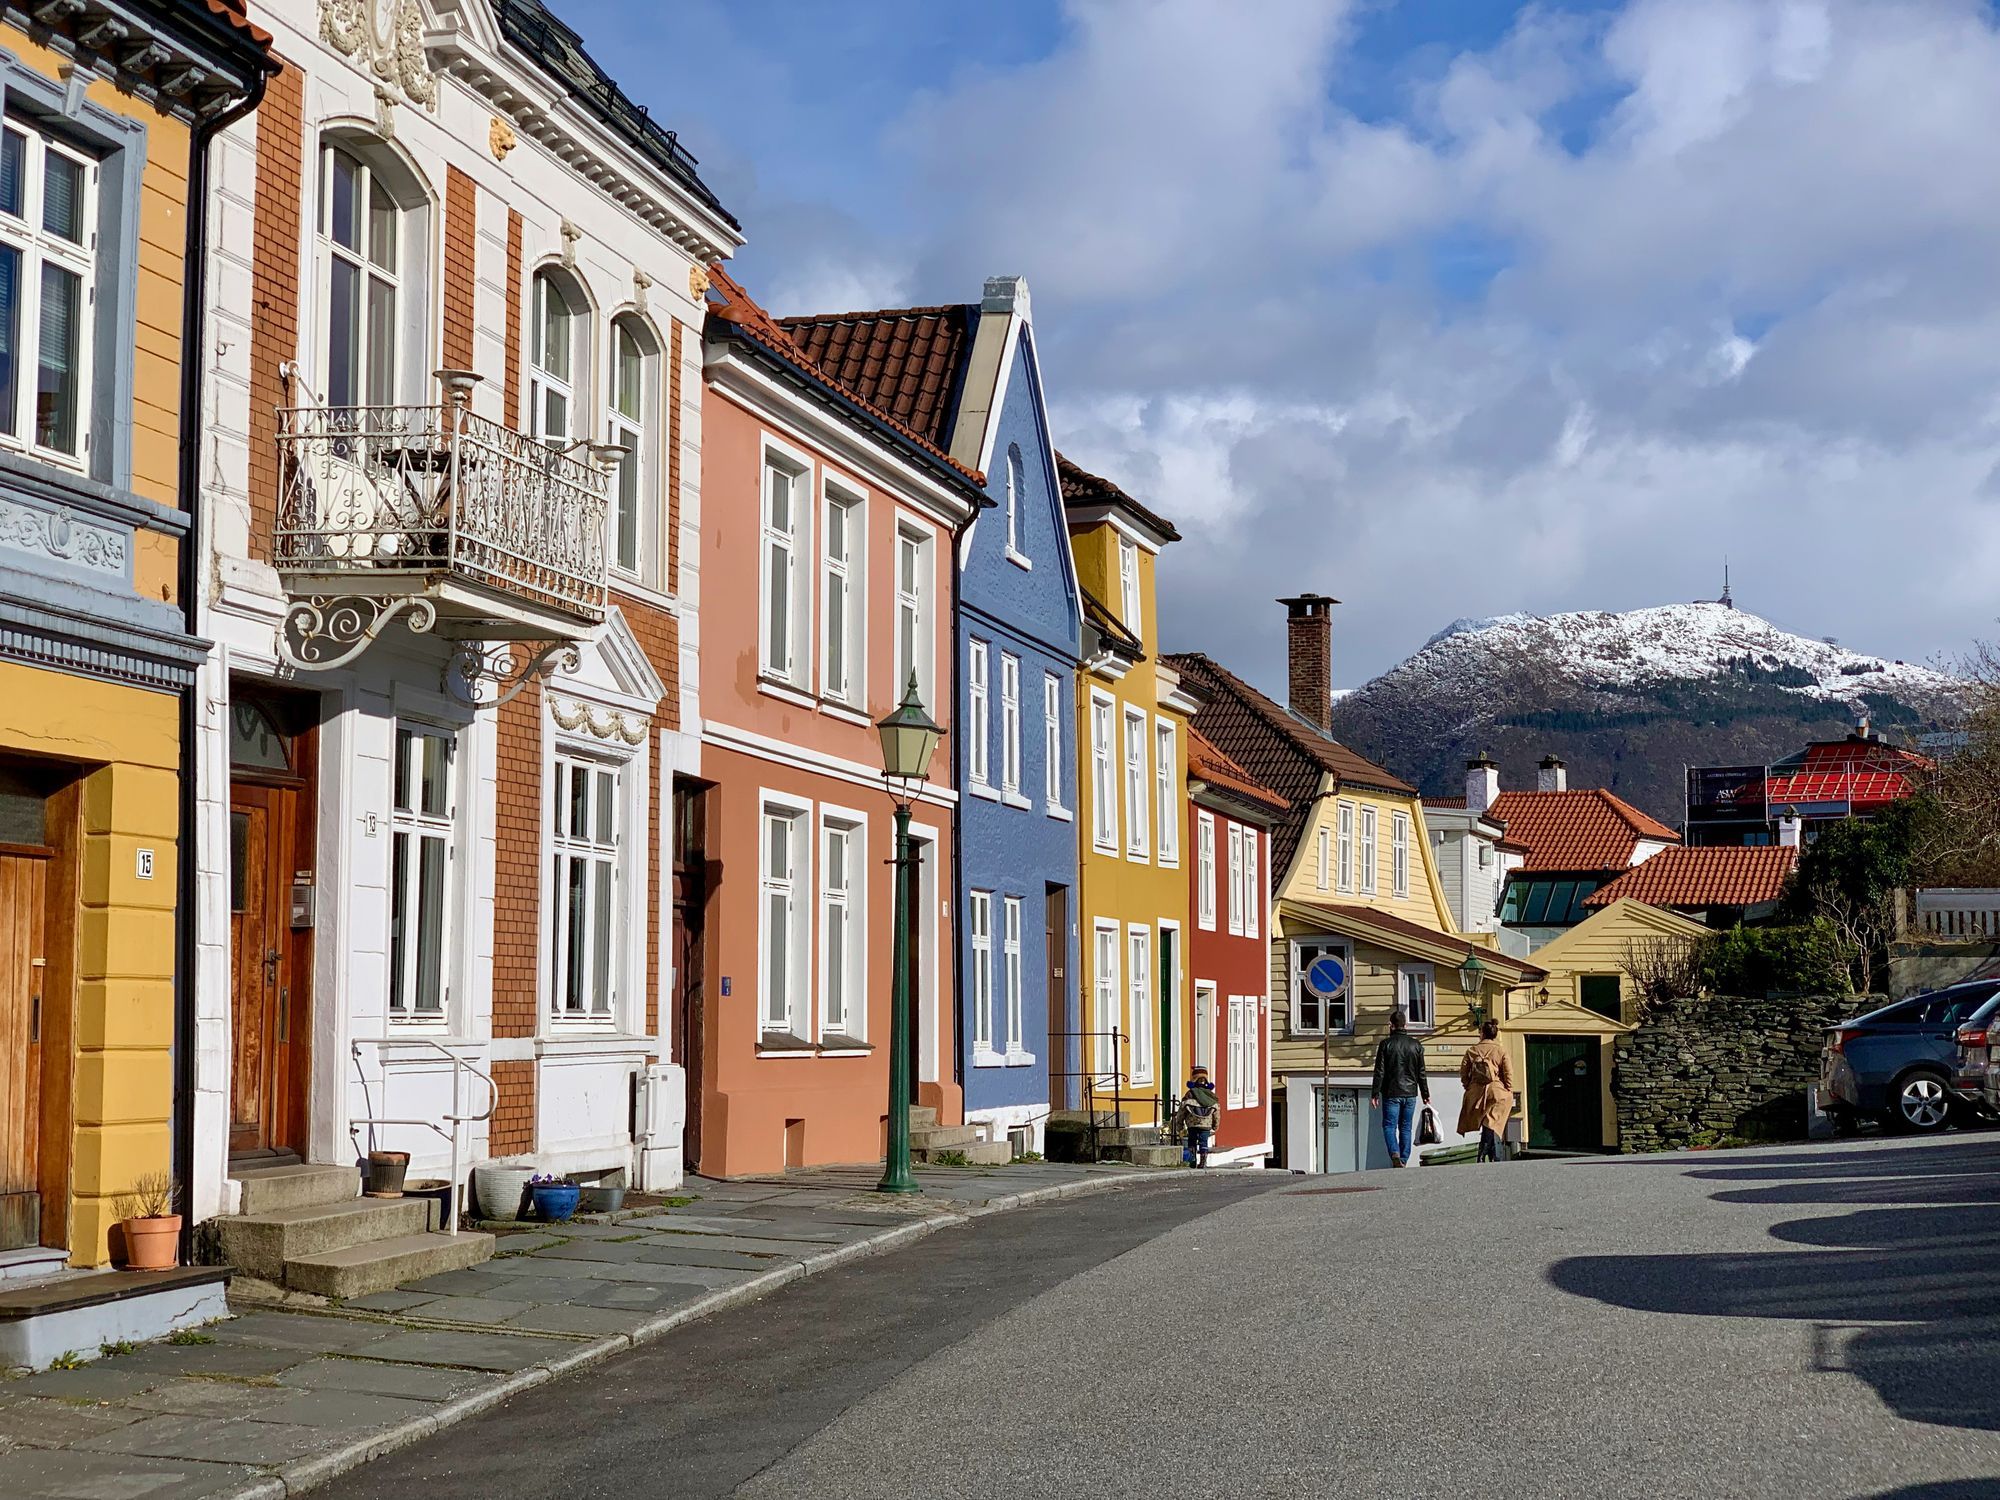
Trip one is already done - five days of train travel through Norway. We rode the Bergensbanen all the way to Bergen on the Atlantic coast, stopping off in Oslo and Flåm along the way. The Bergensbanen is pretty incredible - going from the sea-level suburbs of Oslo, into the forested hills, and then up to the snow-covered Handangervidda plateau at 1,237m. If you want to get a taste of the journey, the Norwegian public broadcaster recorded a seven-hour video of the view from the front of the train, and it's up on YouTube. Just the thing to put on in the background while you're working.
Here's one of my fav pics from the trip - check out the tiny houses at the bottom for scale:

Next up, over the Easter Weekend, is a walk along Kullaleden - which follows the coast north of Helsingborg up to Ängelholm. It's about 80km, and we're doing it over four days and staying in hotels and hostels, so the pace should be pretty relaxed, with plenty of time to explore and take photos. I'll let you know how that goes in my next issue.
My Loud Numbers ambitions for April revolve around reveloping the website, making some remixes and creating a plugin for virtual modular synth software VCV Rack that allows for sonification.

The plugin first. VCV Rack modules are written in C++, which I've never written before and know very little about, but in February I worked my way through the free Codecademy C++ course to get the basics, and I'm starting to get my head around it a bit. The syntax is pretty close to Javascript, which is good because I'm comfortable in Javascript, but there are a lot of weird floats and structs and enums everywhere that I'm still trying to get my head around.
Progress is being made. On Friday I worked through the VCV Rack plugin development tutorial, which was simpler (and shorter) than I was expecting, and then I set about modifying things for my needs. What I'm trying to do is create a virtual module which loads a CSV file containing data, allows the user to pick a column, then jumps from datapoint to datapoint every time it receives a trigger, spitting out control voltages based on the data that you can send other modules that actually make sounds. By the end of Friday I had hit the milestone of being able to recognise when a trigger is received and send out a gate of variable length.
Then on Saturday (yesterday) I developed it a bit further. I hardcoded some data, and got the sonification bits working nicely - it can now happily convert a series of datapoints into various control voltages, including a 1V / octave output, which is the standard for pitch signals in Eurorack and VCV. You can adjust the range of octaves it maps over (1-8), as well as the length of the gate that it outputs, and there's also a trigger input for resetting to the beginning.
The next step is (re-)designing the interface to take account of a couple of usability factors that I've thought of while coding it, as well as building the crucial functionality of loading in and parsing a CSV data file. That'll undoubtedly be a challenge. But I've got a lot further in a few days than I expected to, so I'm pleased with that.
I hope at least some of the above made sense to you. Either way, here are a couple of in-progress UI design sketches I've been making in my big A4 notebook.

For the Loud Numbers website, the goal for this month is to redevelop things so that it presents a studio rather than simply a podcast. We've done quite a bit of commercial sonification work off the back of the podcast, and we'd like to push a little harder on this - with a little showreel of what we can do.
Right now we're thinking that there'll be a pretty simple homepage with the showreel and a contact form, an "about" page that presents us and tells the Loud Numbers story, a page for the podcast so it has somewhere to live, and then a page that houses the work we're doing around convening the sonification community.
The current Loud Numbers homepage was just written in HTML and CSS in a code editor, but now that things are getting a little more complicated, I want to experiment a little with Webflow, which seems to be the new hotness when it comes to web design. I don't imagine I'll end up hosting it permanently with Webflow, but it allows for HTML export so it should be possible to build a static site there and then host it on Netlify or similar. My friend Jane built her site that way, and it looks great.

I think I've mentioned a few times in the past that we're planning to release an album of Loud Numbers remixes to mark the one-year anniversary of the release of the podcast. We've got four in the bag already, from fans of the show, and Miriam and I are planning to record a few ourselves too.
I'm thinking that I'm going to tackle three different episodes, and see how far I get. I think The Natural Lottery (originally a techno track) could work well as a dubby, ambient experience, a bit like The Radio Dept's "Never Swallow Fruit". I want to rework A Symphony of Bureaucracy with my Eurorack setup, perhaps with some glitchy beats in the background. And finally, I want to go full-on Boards of Canada with The End of the Road.
We're also still very open to recruiting more fan remixes, and we can supply the stems - if you're been looking for an excuse to flex your musical muscles then get in touch - hit reply to this email and we'll go from there.
Last year I created a data sonification of the impact of Covid-19 on London as part of Valentina D'Efilippo's London Under the Microscope animation. The result is one of my favourite pieces of work in recent years.
Valentina recently appeared on Andy Kirk's Explore Explain podcast to talk about the project and how it came together - including the sonification. You can watch the recording here, the bit about the sonification begins around 51m 35s.
Okay, that's enough about me. Here are a few interesting things I've seen recently on the web.
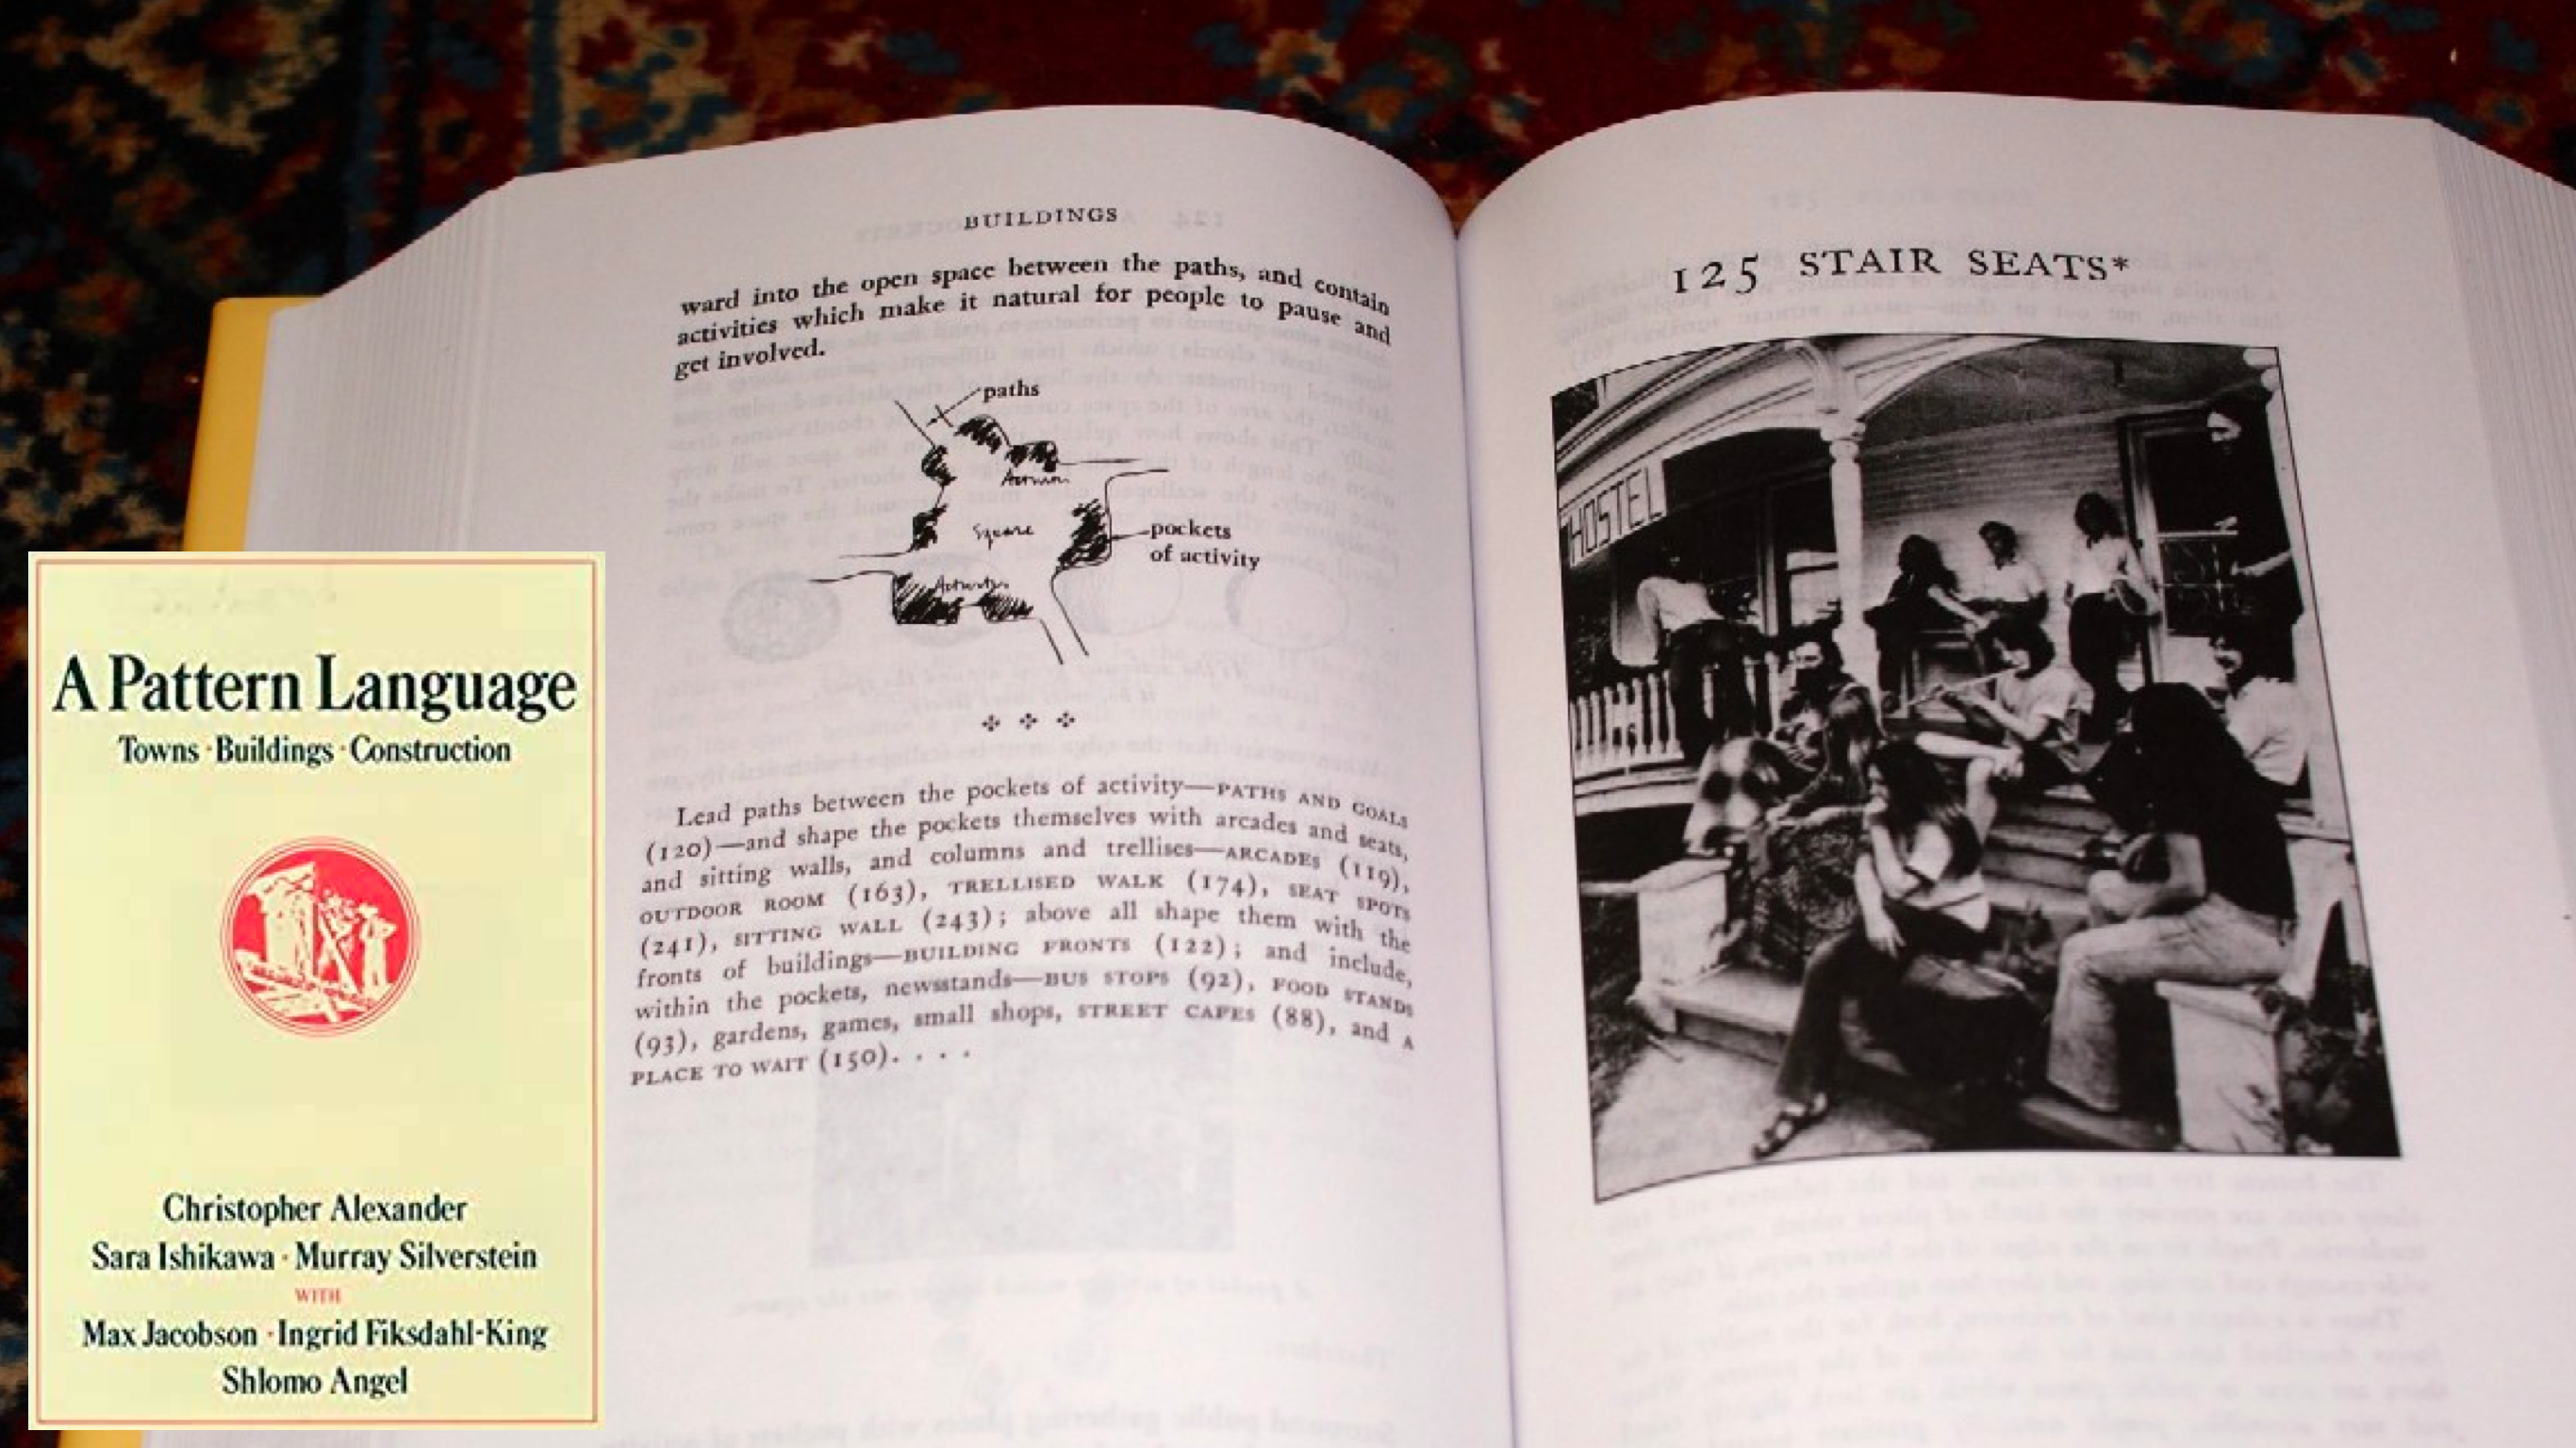
First, given everything that's going on, it's very likely that you didn't hear the news that architect and urbanist Christopher Alexander has died. I've been a huge admirer of his since discovering his book A Pattern Language in July 2020 (the way I wrote about it in my newsletter at the time gives you a sense of my excitement at the discovery). The structure of the book inspired the development of wikis, which in turn led to the creation of Wikipedia, so pretty much everyone owes him a great debt of gratitude. There's a great review of his life, and why his work is still revelent today, in Planetizen.
I've been feeling a huge amount of climate anxiety recently, much more than usual, so I won't talk too much about the latest IPCC report on how we can deal with the climate crisis, except to point you to this collection of very human-readable headlines from the report.

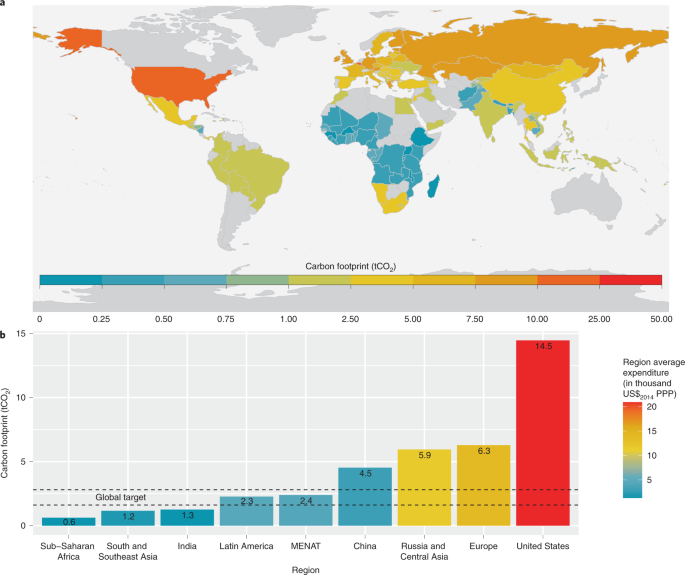
The IPCC reports are not new research, though - they're summaries of the last five years of the science, and the very latest findings don't make it in due to the lengthy review process. One recent finding that I thought was worth highlighting is work done by the World Inequality Lab looking at who's driving climate change, summaried helpfully in this great Bloomberg article. The article reads:
There’s growing evidence that the inequality between rich and poor people’s emissions within countries now overwhelms the country-to-country disparities. In other words: High emitters have more in common across international boundaries, no matter where they call home.
 Eric Roston, Leslie Kaufman and Hayley Warren
The killer chart comes near the end of the article, showing the rise and fall of emissions among the global rich and poor in the last 30 years. Since 1990, about 16% of the rise in emissions has come from the poorest 50% of the world's population, while 21% of emissions growth has come from the richest 1%. Emissions from the top 0.001% have more than doubled in this time. This is a rich person problem, and rich people need to change their habits to address it.
Compounding that analysis is a study that came out in February which shows that lifting a billion people out of poverty will increase emissions by 1.6–2.1% or less. Next time someone mutters something about "population" when you're talking about climate change, those are useful stats to respond with.
Relatedly, I recently finished up an information design assignment with Project Drawdown, visualizing the win-win solutions that simultaneously solve the challenges of climate change and global poverty. Their full report is well worth a read.

What can we do in richer countries? Well, not wasting the energy we generate is a huge part of the puzzle that's rarely talked about. In this Guardian interview, civil engineer Amory Lovins talks about what needs to happen.
“It turns out that if you make a car out of carbon fibre, you also save two-thirds of the investment in water and half the energy space and time needed to put the car together. And it needs a lot fewer batteries because it’s holding less weight because the carbon fibre is light. You pay for the carbon fibre by needing fewer batteries and smaller propulsion system all round. So if you do this across the whole economy, really designing whole systems in factories, equipment, buildings, vehicles, you’ll end up with severalfold larger energy savings than practically anyone now thinks is available. And the cost goes down.”
He has some choice words about nuclear power:
The most energy-inefficient design of all, he says, may be nuclear power, which is heavily subsidised, costly and pushed by a politically powerful lobby. Using it to address shortages of electricity or to counter climate change, he argues, is like offering starving people rice and caviar when it’s far cheaper and easier to give just rice.
“When you have a climate and energy emergency, like now, you need to invest judiciously, not indiscriminately, to buy the most efficient solution. Far better to deploy fast, inexpensive and sure technologies like wind or solar than one that is slow to build, speculative and very costly. Anything else makes climate change worse than it needs to be.”
If I ever get the opportunity to build my own house, I want one like his, which has no heating and cooling systems at all.
 John Vidal
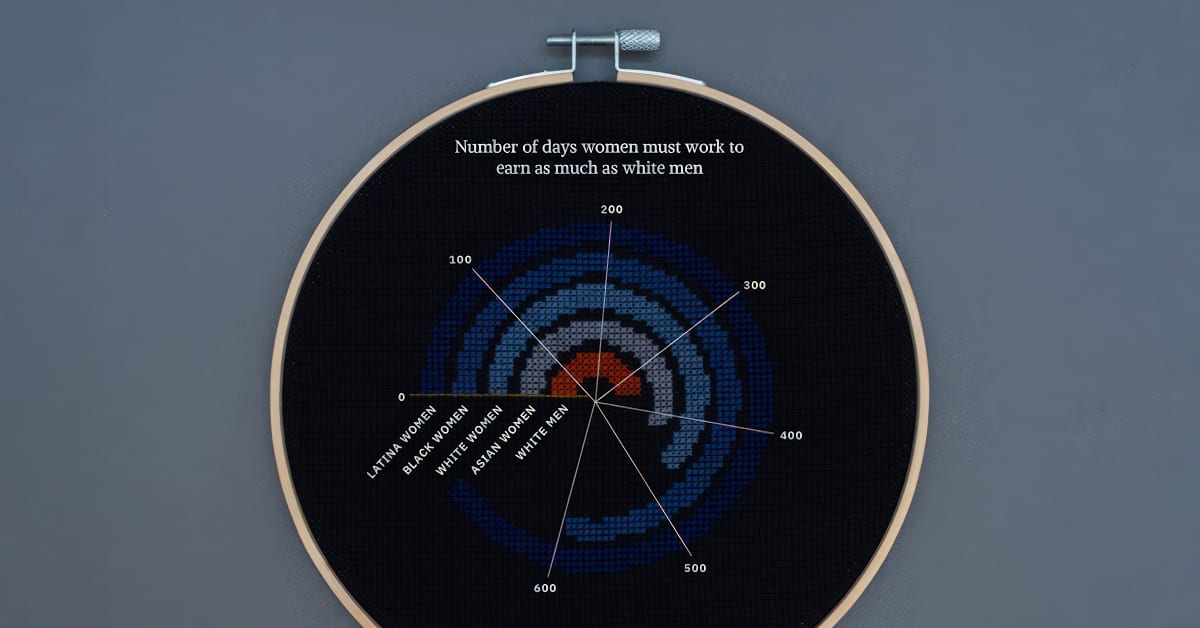
Textile artist Olivia Johnson has released a Domestika course all about cross-stitching data visualization.
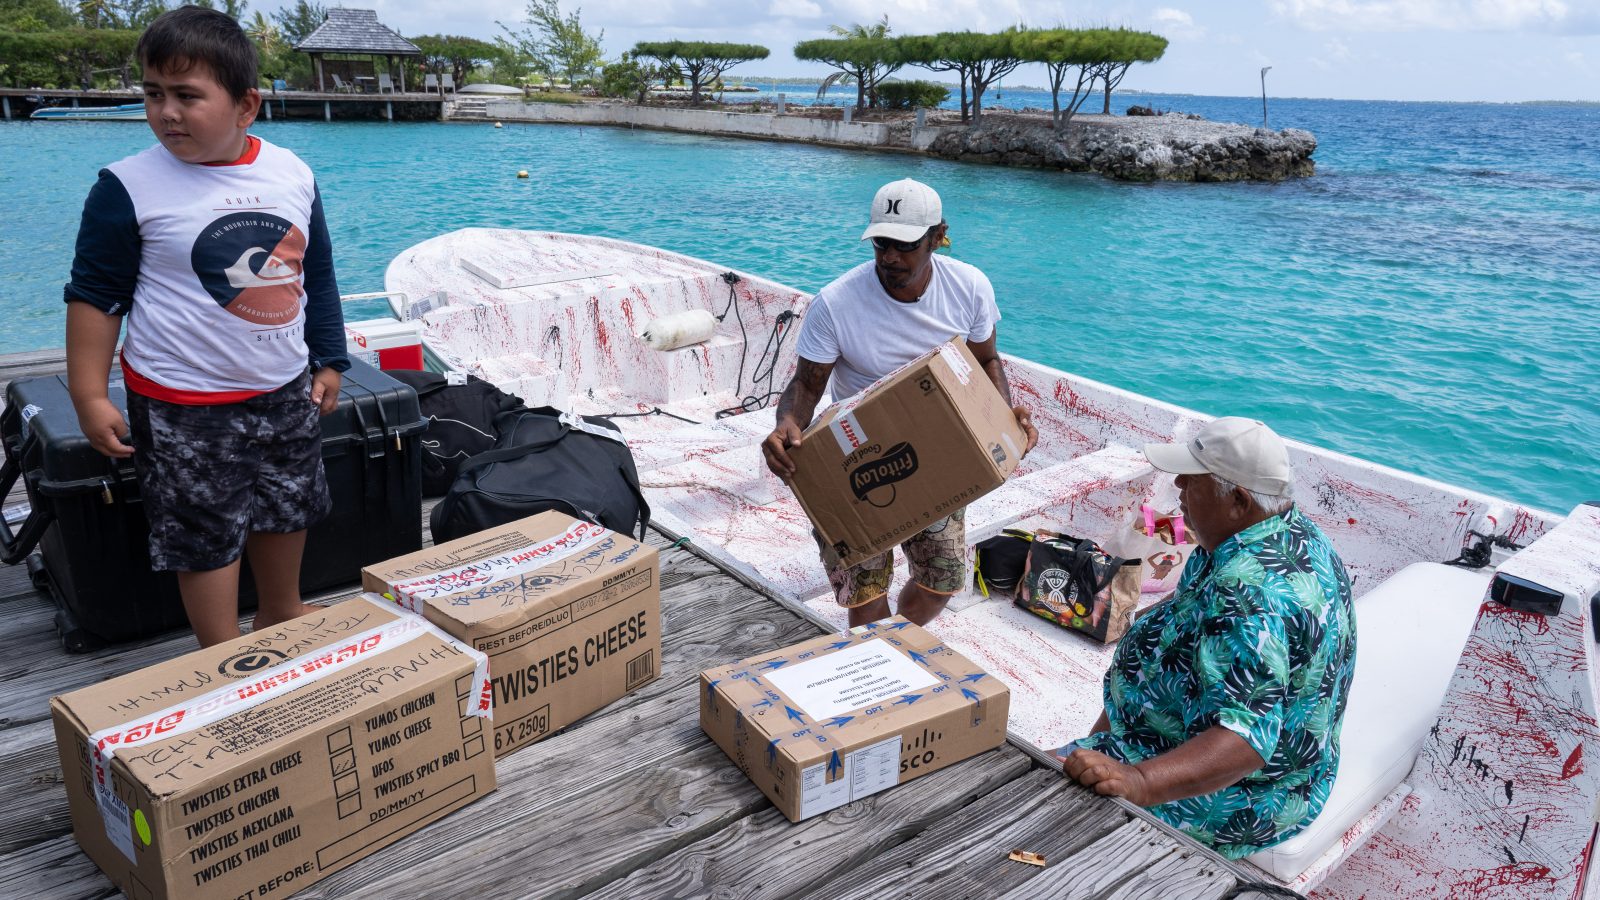
FInally, I'll leave you with this wonderful article from Rest of World about French Polynesia's nascent online delivery scene: "Online shopping in the middle of the ocean".
That's it for today. Sorry it was kinda long! See you again in about ten days for what will hopefully be a rather shorter edition.