
Tools I Love #2: Flourish


The best free platform for making charts on the web is Flourish. It has the best balance of usability, chart types, customisation and export options.
Flourish has been a vital part of many of the visualizations I've made. Most complex charts are combinations of simple charts, and Flourish makes it quick and easy to generate those simple charts - with no coding required.
It's trivial to use. Format and clean your data, paste it into Flourish's data tab, then simply map different variables to different chart attributes. Tweak lightly through the interface, and then export an SVG - which can be edited in any vector graphics software (more on my favourite vector graphics software soon).
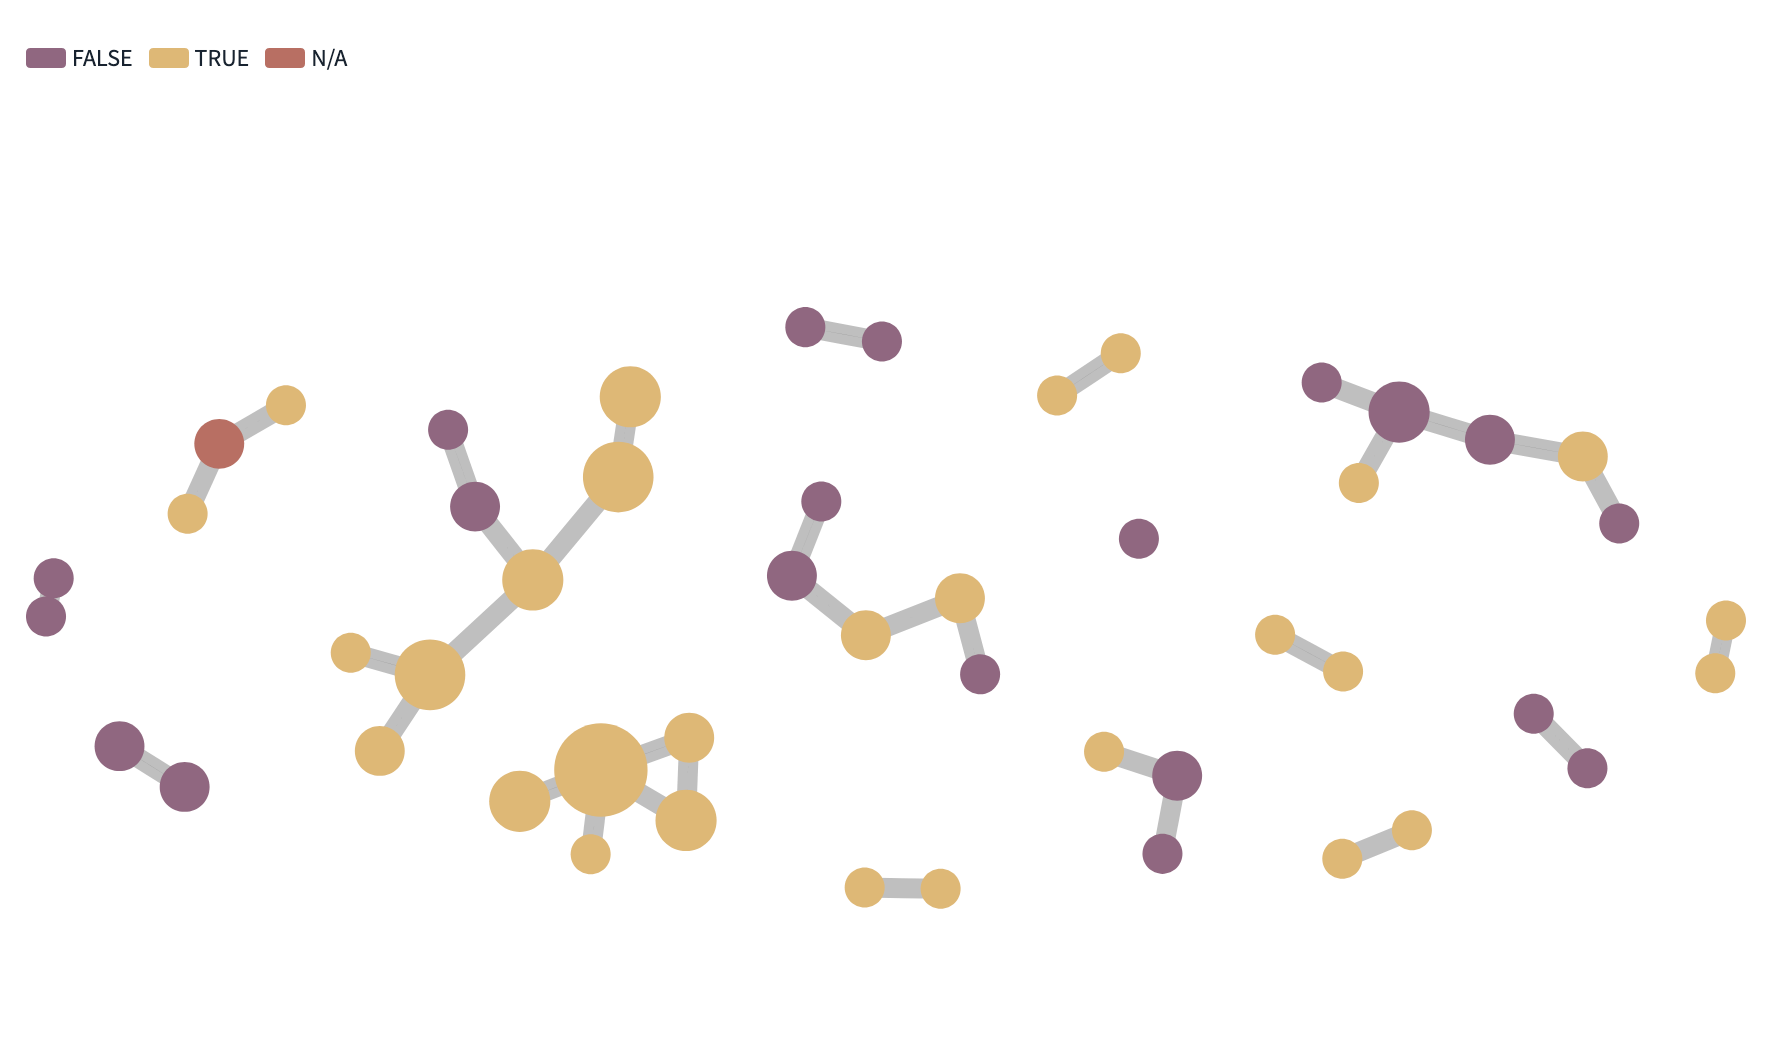
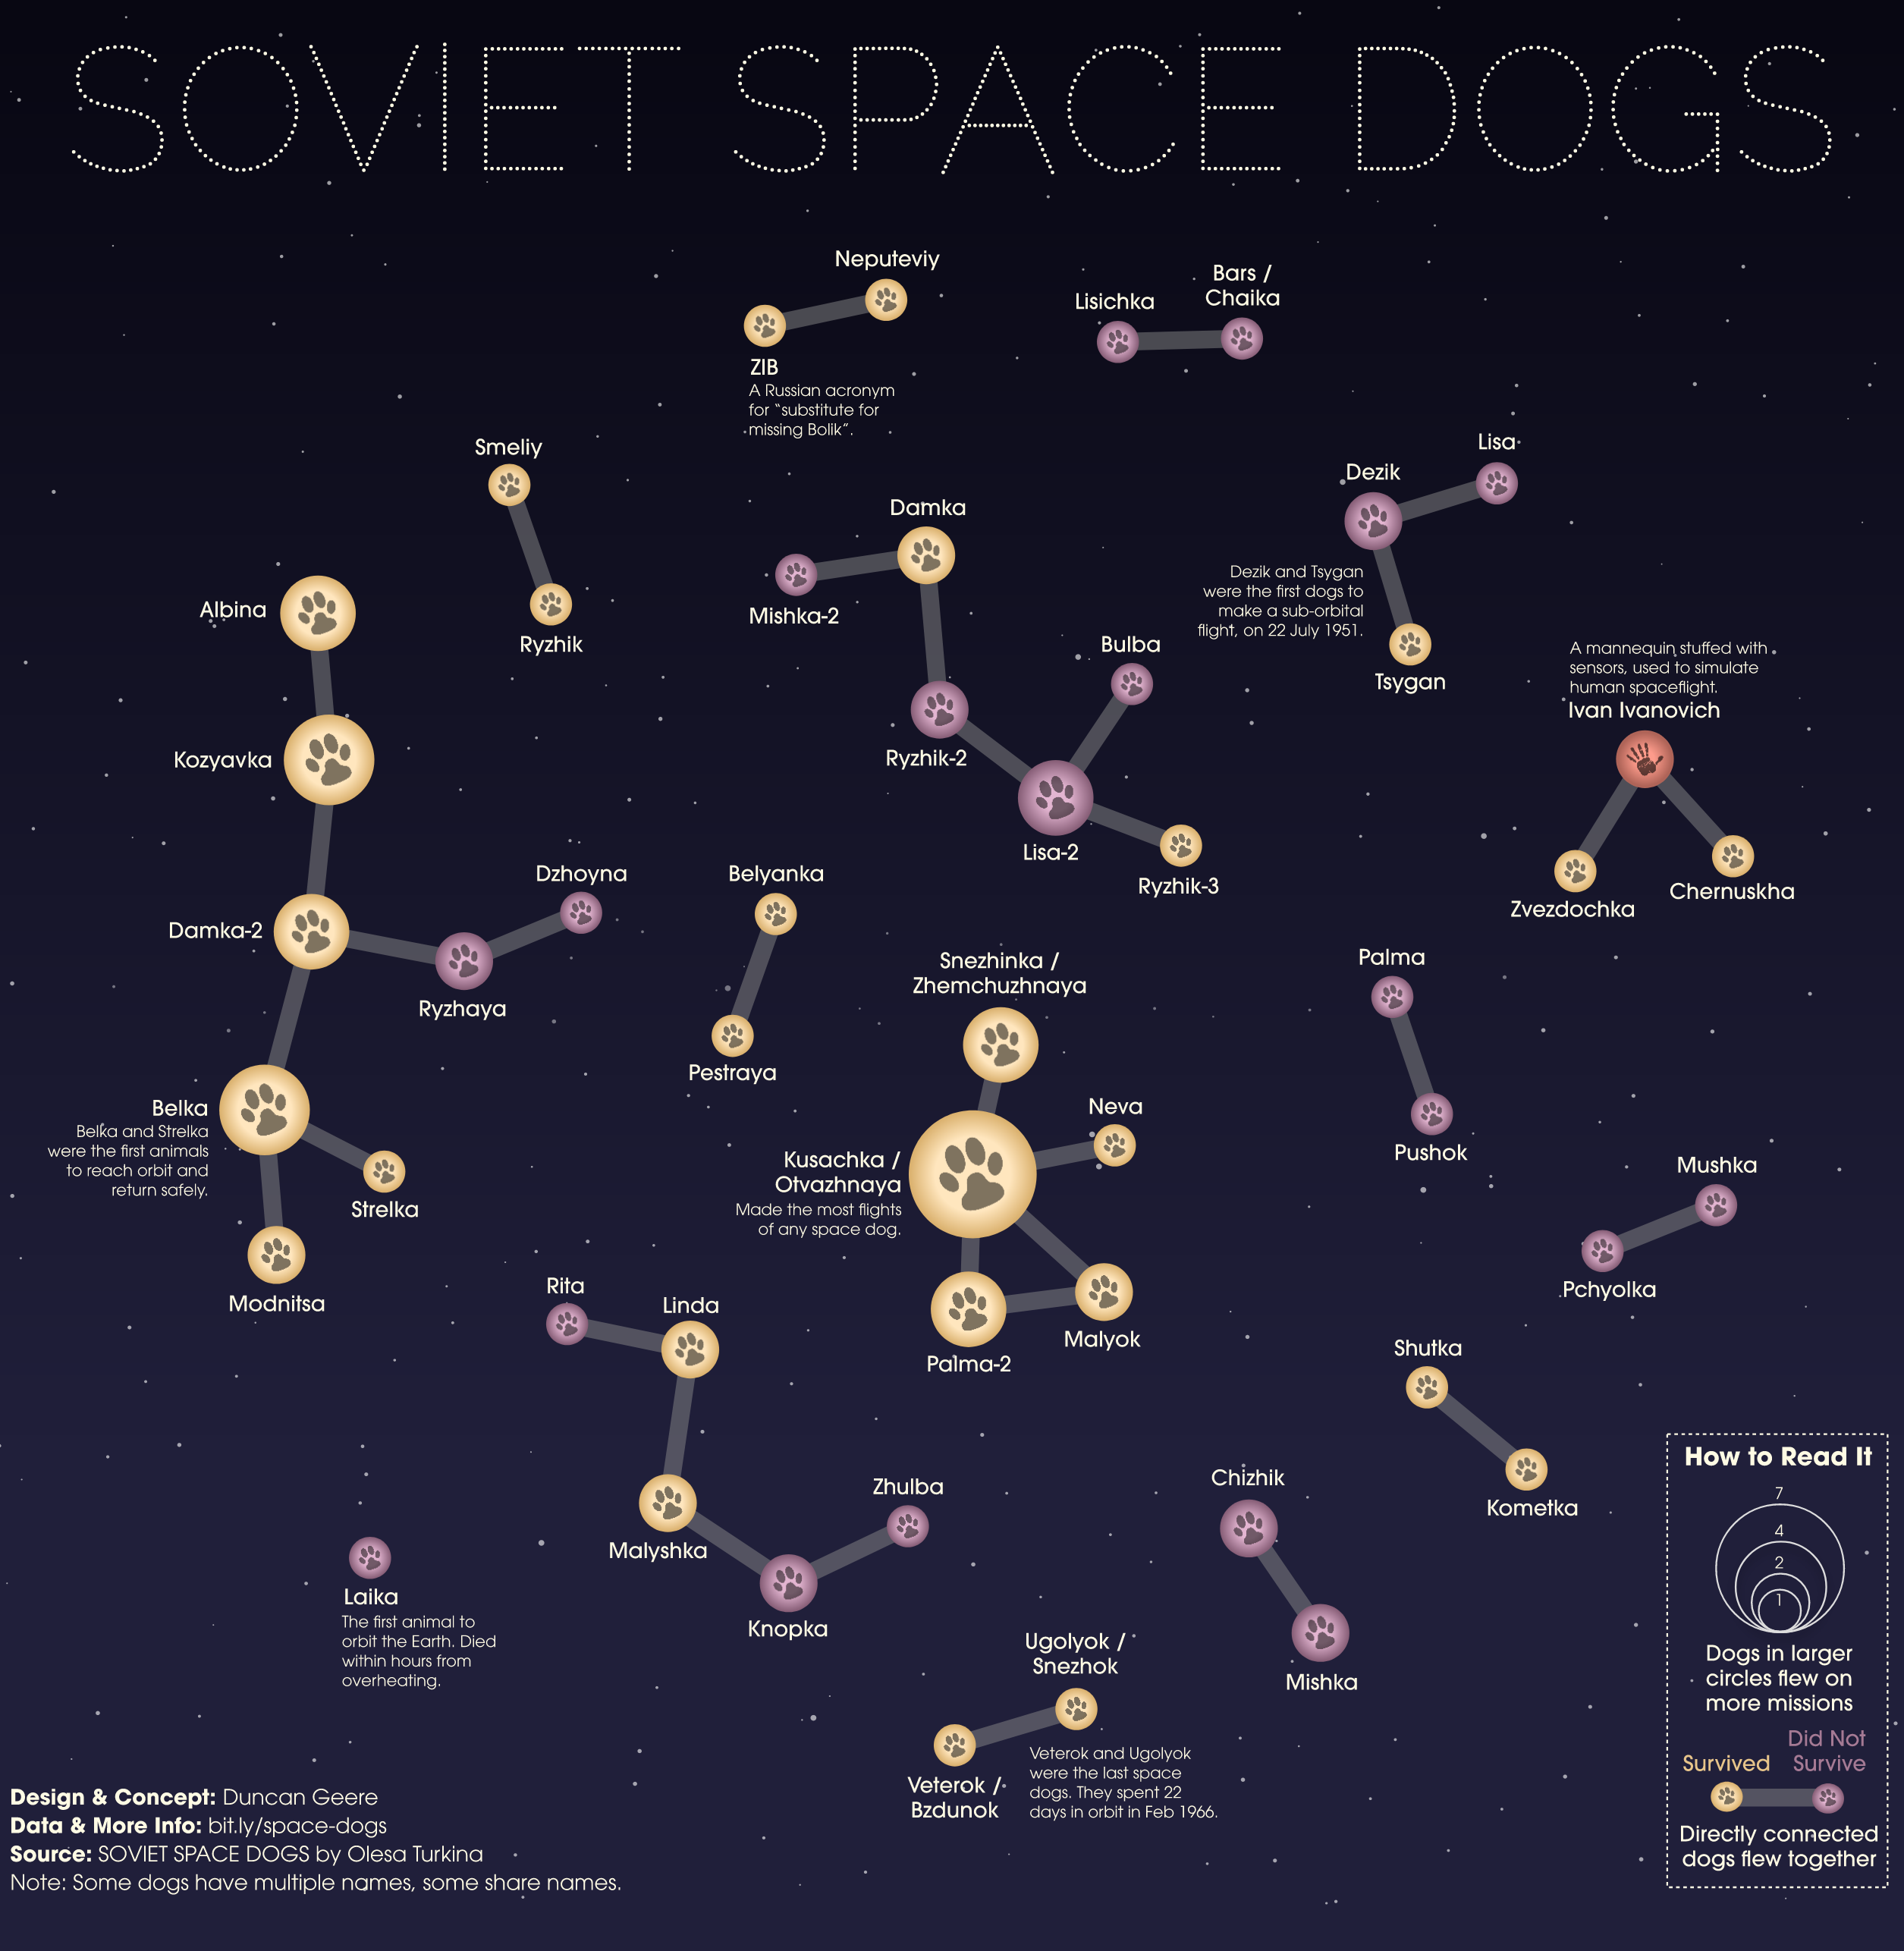
My Space Dogs graphic, for example, started out life as a Flourish network graph:
If you like, you can also publish your work directly in Flourish - and even build up multi-page visualization presentations. I did exactly that with my prize-winning In Other Waters story.
I use and love RawGraphs, Datawrapper, Sankeymatic and good ol' Google Sheets for specific tasks. But for a great all-purpose tool, you can't go wrong with Flourish.
For more tools I love, step right this way.