
Tenday Notes 1 Jan - 10 Jan 2020

Every ten days I share a quick digest of what I've been working on. Here's the latest. More in the series here. Want them in your inbox? Sign up.
This is a newsier collection of notes than normal because I have a few bits of personal news to share. That stuff is at the top, but underneath I've also snuck in a few interesting other bits and pieces so it's not just all about me.
Shall we begin?
I have a new job! This week I had my first day at Possible, a London-based climate charity. My official job title is "data visualization designer", which will involve creating data visualizations, infographics and maps - primarily on the Car-Free Cities campaign.
As you'll likely know if you're reading this blog post, I do a lot of work related to climate change. It's the greatest threat facing humankind, and solving it will make life better for billions of people all around the world. I've been studying, writing about, and doing visualization work around the subject for decades, but I wanted to join Possible for a few key reasons.
The first is that I want to reach a larger audience. My solo climate projects have been well-received, but being part of an organization means my work will be seen by many more people. That's important for that work having a larger impact.
The second is that it's easier to do better work in a team, and especially a team as good as Possible's. I've worked with the charity in the past - on the Riding Sunbeams project, and on another project around heat pumps (I wrote this explainer). I was an enthusiastic backer of the Carbon City Zero card game project, too. I've admired Possible's work for years, because its positivity. The focus is on "facing our climate dread with a can-do attitude and sense of fun".
Finally, the position is part-time, so I'll still be able to take on client work on projects around data visualization and information design. If that's something you're interested in talking to me about, then go check out my website and portfolio. I'll have time to finish and release Loud Numbers (the data sonification podcast that I'm working on with Miriam Quick) too, which is a key priority for me this year, and I'll continue to work on personal projects in whatever time remains.
If you like the look of Possible's work, there are lots of ways to support the organization. You can check out the list of projects that we're currently working on. You can join up as a supporter, which costs nothing. Or you can make a donation, which will go towards our work developing inspiring solutions to the climate crisis.
Finally, if you're a freelance web developer with a good understanding of Squarespace, we're looking for a little help making our website more accessible. Find out more on Possible's careers page.


The speakers for Outlier 2021, the first conference of the Data Visualization Society, have just been announced and I'm really pleased to be among them!
Together with Miriam Quick, I'll be talking about Loud Numbers - the data sonification podcast that we've been working on for a year or so. Here's the talk description that we pitched :
People have been telling stories with music for millennia. Music can uplift us, console us, excite us, scare us, and energise us. It speaks to the heart as well as the head.
So why aren’t more people using it to tell data stories? Sonification – the practice of turning data into sound – has been around for more than a century, but it remains niche when compared to the explosive popularity of visualization.
In this talk, we’ll look at some of the reasons why this might be and share what we’ve learned about effective storytelling with music and data in the process of creating Loud Numbers – the world’s first data sonification podcast.
We’ll look at the landscape of sonification possibilities, from audification, through “earcons” and live data soundscapes, to complex parameter mapping.
We’ll share what we’ve learnt about the kinds of data and stories that are most suited to clear, compelling sonification, and how to avoid confusing listeners.
And we’ll go in-depth into one of the episodes from Loud Numbers Season 1 – explaining the story, the data, and how we encoded it into music. We’ll end with a world-exclusive preview of the final track from that episode.
People who watch the talk will learn how to create powerful, compelling data narratives with sound and music, and get an exclusive first look at one of the most exciting data projects of 2021.
Not totally sure how we're going to fit all that into our 20 minute timeslot, but we'll do our best! I'm most excited about doing a "live" (pre-recorded, but performed over video) version of one of the episodes of the podcast.
Those who've been paying attention will know that I'm also a member of the Data Visualization Society's events committee - which is organizing the conference. To keep things fair, I recused myself from any of the conversations around speaker selection.
What I am extremely proud of, though are the measures that we put in place to ensure diversity in speaker selection. You can read the full details here. I hope this approach can serve as an inspiration for other conferences that want to accomplish something similar.
Go get yourself a ticket right now for whatever price you feel is fair.


Then the third and final bit of news is that at some point this year I'll be leaving Gothenburg. My partner, Silfa, has a new job as an enzyme technology specialist at Oatly - which is based in Landskrona in Skåne, the south of Sweden.
We're not sure exactly when we'll be moving, because so much depends on the trajectory of the Covid-19 pandemic in the coming months. We're not even sure where we'll be moving to - the shortlist right now is Lund, Helsingborg and Landskrona itself. But the uncertainty is generally about "when" not "if".
I'll be sad to leave Gothenburg, especially on its 400th birthday. But we plan to keep the apartment we own here for the time being. At this point, it's very hard to know what the future will bring so it's good to have options.

If you know a lot about Lund, Helsingborg and Landskrona, then hit me up with the best places to live in any of those towns. If you don't, then just wish us luck for moving home in a plague year!
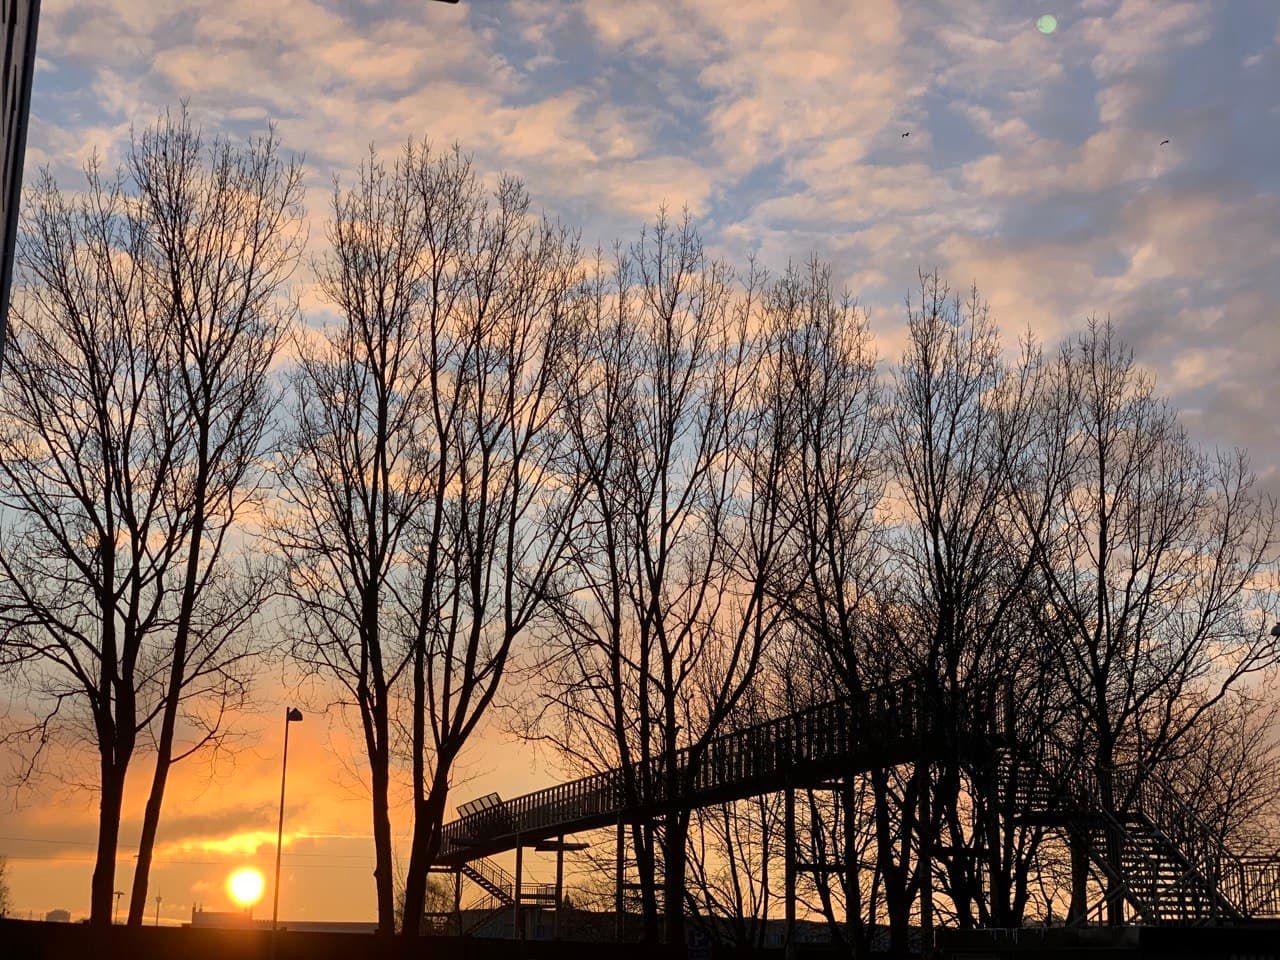
I've been doing a little bit of plotting over Christmas and the start of January. I blogged some of it, and tweeted some more. I've been loosely following Genuary, but not with any commitment because life feels very, very busy right for for the reasons above. When I do get a moment to myself, I'm preferring to pick up a book rather than spending more time on a screen writing code.

Speaking of books, I finished Ursula K. Le Guin's The Dispossessed before Christmas, which is a classic sci-fi novel that's just as good as everyone says it is. I'm now half-way through Deirdre Mask's The Address Book, which is a non-fiction book about street names (Guardian review). It's not a joyful read, as there's a lot of institutional racism portrayed, but it's fascinating to learn how different parts of the world approach the issue, for better or worse.
Do you care about spreadsheet etiquette? I do, and I definitely judge people who make bad spreadsheets (while I'm cleaning them up). Here are twelve tips for making better spreadsheets, which are presented as an academic paper but it's short and actually very readable once you get past the intro.
Here's the abstract:
The basic principles are: be consistent, write dates like YYYY-MM-DD, do not leave any cells empty, put just one thing in a cell, organize the data as a single rectangle (with subjects as rows and variables as columns, and with a single header row), create a data dictionary, do not include calculations in the raw data files, do not use font color or highlighting as data, choose good names for things, make backups, use data validation to avoid data entry errors, and save the data in plain text files.
If you spend any of your time making spreadsheets, then I think you'll get a lot out of it.
The KLF have re-entered the building.
I've been trying to stay off the news as much as possible, with mixed results. I'm looking for a good resource for news that has a longer timeframe than hours/minutes, so if you know of anything along those lines then do let me know.
One piece that I did like is the Observer's review of "how global politics will change this year", authored by its correspondents from across the world. It's big-picture stuff, and I found it a really useful primer on what's been happening lately in places that haven't really been in the news.
 Emma Graham-Harrison
That's all for this week. Stay well, and stay safe.