The Impact of Dieselgate

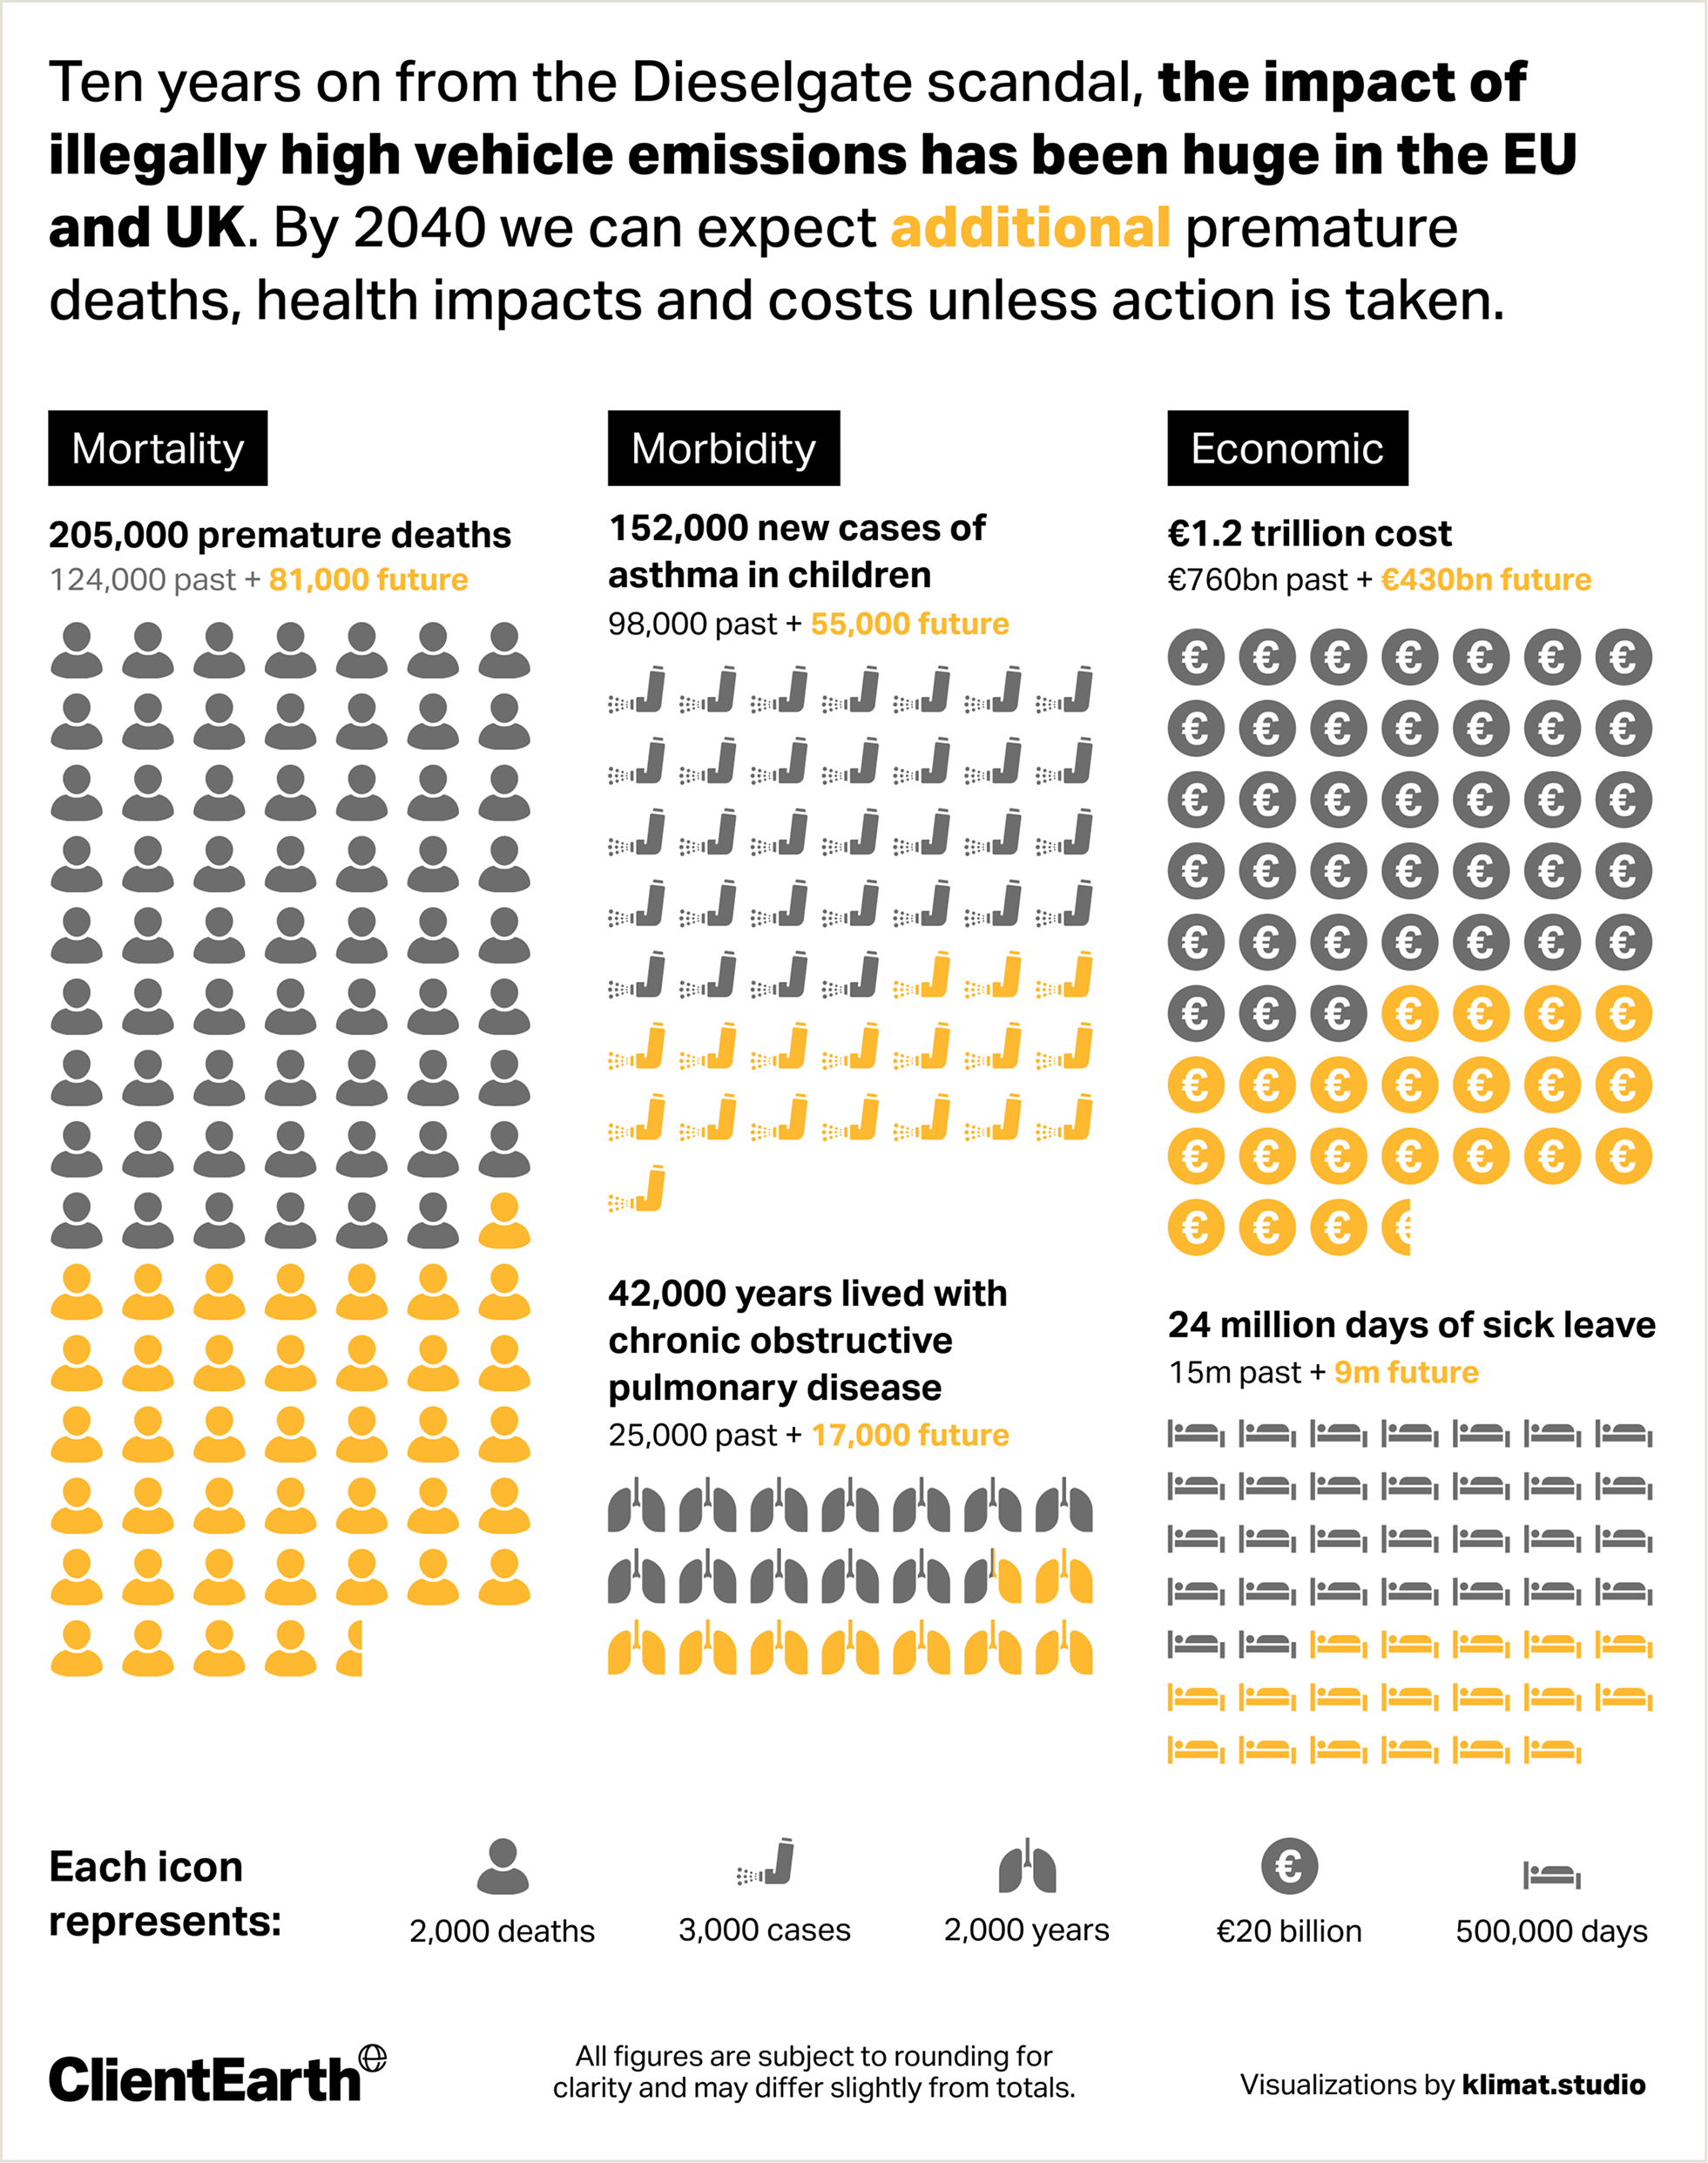
ClientEarth, an international environmental law charity, hired me to develop a collection of data visualizations to show the impact of the ‘Dieselgate’ scandal, where EU carmakers cheated emissions testing.
The goal was to demonstrate to a general audience on social media the financial and human damage caused by the illegally high vehicle emissions, over both the past decade, and projections for the future. There were versions created for EU, UK, and French audiences.
The work began with a report draft and a spreadsheet, and from there I developed a iconographic system for representing the figures, in the style of the ‘Isotypes’ created by Otto and Marie Neurath in the mid-20th century. Each different icon represents a different statistic, and the number of icons reflects the figure to be visualized, all closely following ClientEarth’s in-house style guide.
After a few rounds of revisions, the work was published on LinkedIn and other ClientEarth social media channels to draw attention to the release of a report into the topic.
If you'd like me to help you make something similar for your organisation, head over to my data visualization studio site: