2020 in Review: Generative & Data Art
This the second of three end-of-year roundups that I'm writing about my work in 2020, covering information design, generative & data art and community building. I’ll be talking about what I’ve created over the course of the past year, but also what I’ve learnt in the process.
I've been operating on the border of data art for some time, and I've poked at it in the past. But my first forays into the field this year were in the context of dataviz sketching. I had been seeing beautiful pen plotter artworks pop up occasionally on Twitter, and every so often I would scroll with fascination through the #plottertwitter hashtag. I had a strong feeling that this was something I very much wanted to get into.
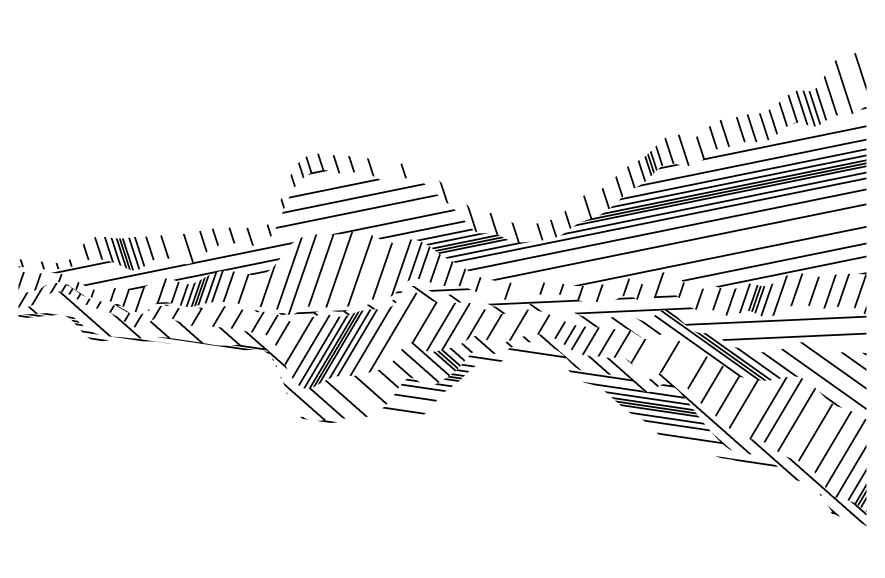
One of those works, by Julien Gachadoat, inspired a quick Figma sketch in January where I put real data into the same style. It's not anywhere near as nice as the original, but it's the first sign that I can see of the techniques of generative art influencing my own work.
At the start of February, I impulse-bought a book called Generative Design which I duly blogged about. As I wrote at the time, "It includes a gentle tutorial on how to get started, but also a bunch of 'recipes' for making cool things that you can tweak to generate interesting results."
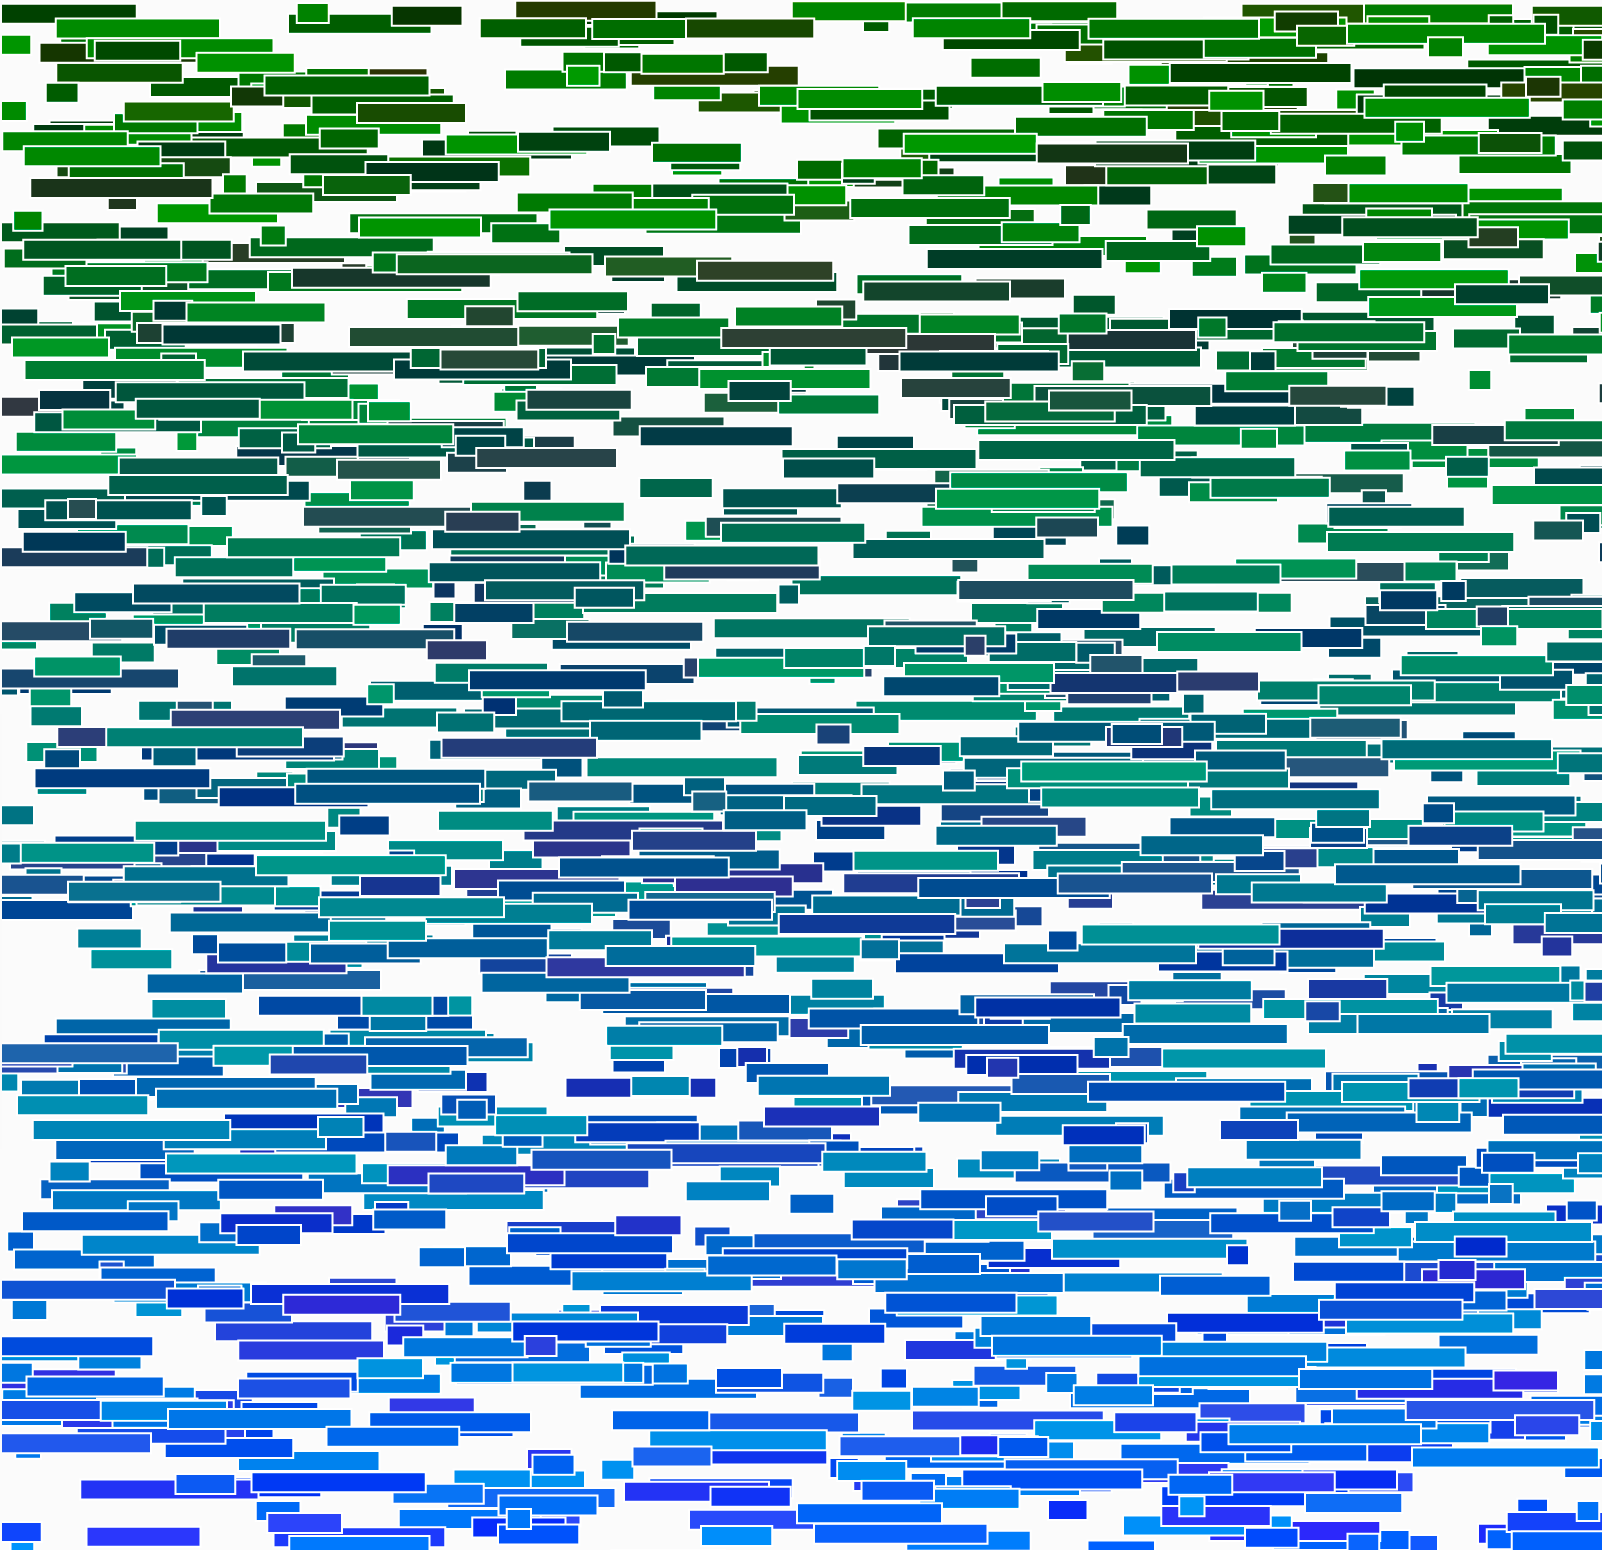
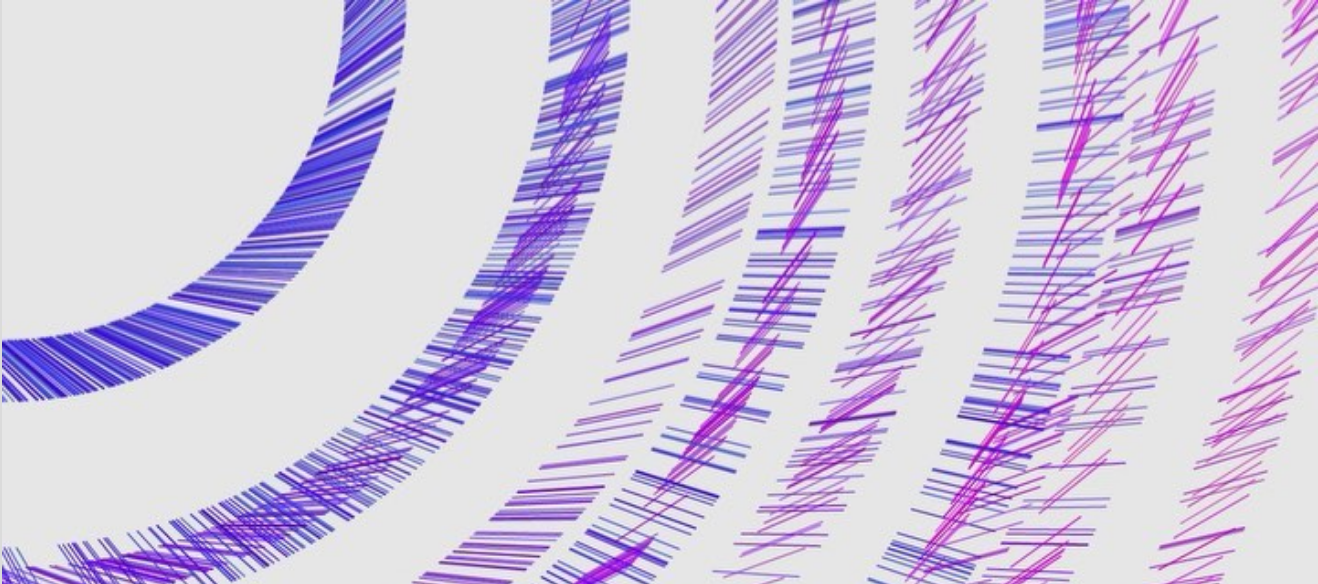
The book uses the p5 library for Javascript, which is a lovely starting point for people who are new to code. Through February and March I continued to make little generative sketches on different topics. At the end of February, I registered an Instagram account (@vhfseizures) dedicated to generative sketches, which I used the rest of the year.

I keep going back and forth on Instagram. One the one hand, it's a great platform for quickly sharing a snap and getting attention on it from people you don't know (as well as people you do). On the other hand, it's about one-third advertising, its loops are too tiny, and its use makes Zuckerberg into a richer secret lizard person. I haven't yet decided how much I want to continue to use it in 2021.
In March I was already crossing over my information design and generative art practices. I created a series of pieces called "Smoulder" that riffed off my Carbon in Context graphic to capture how climate change feels.
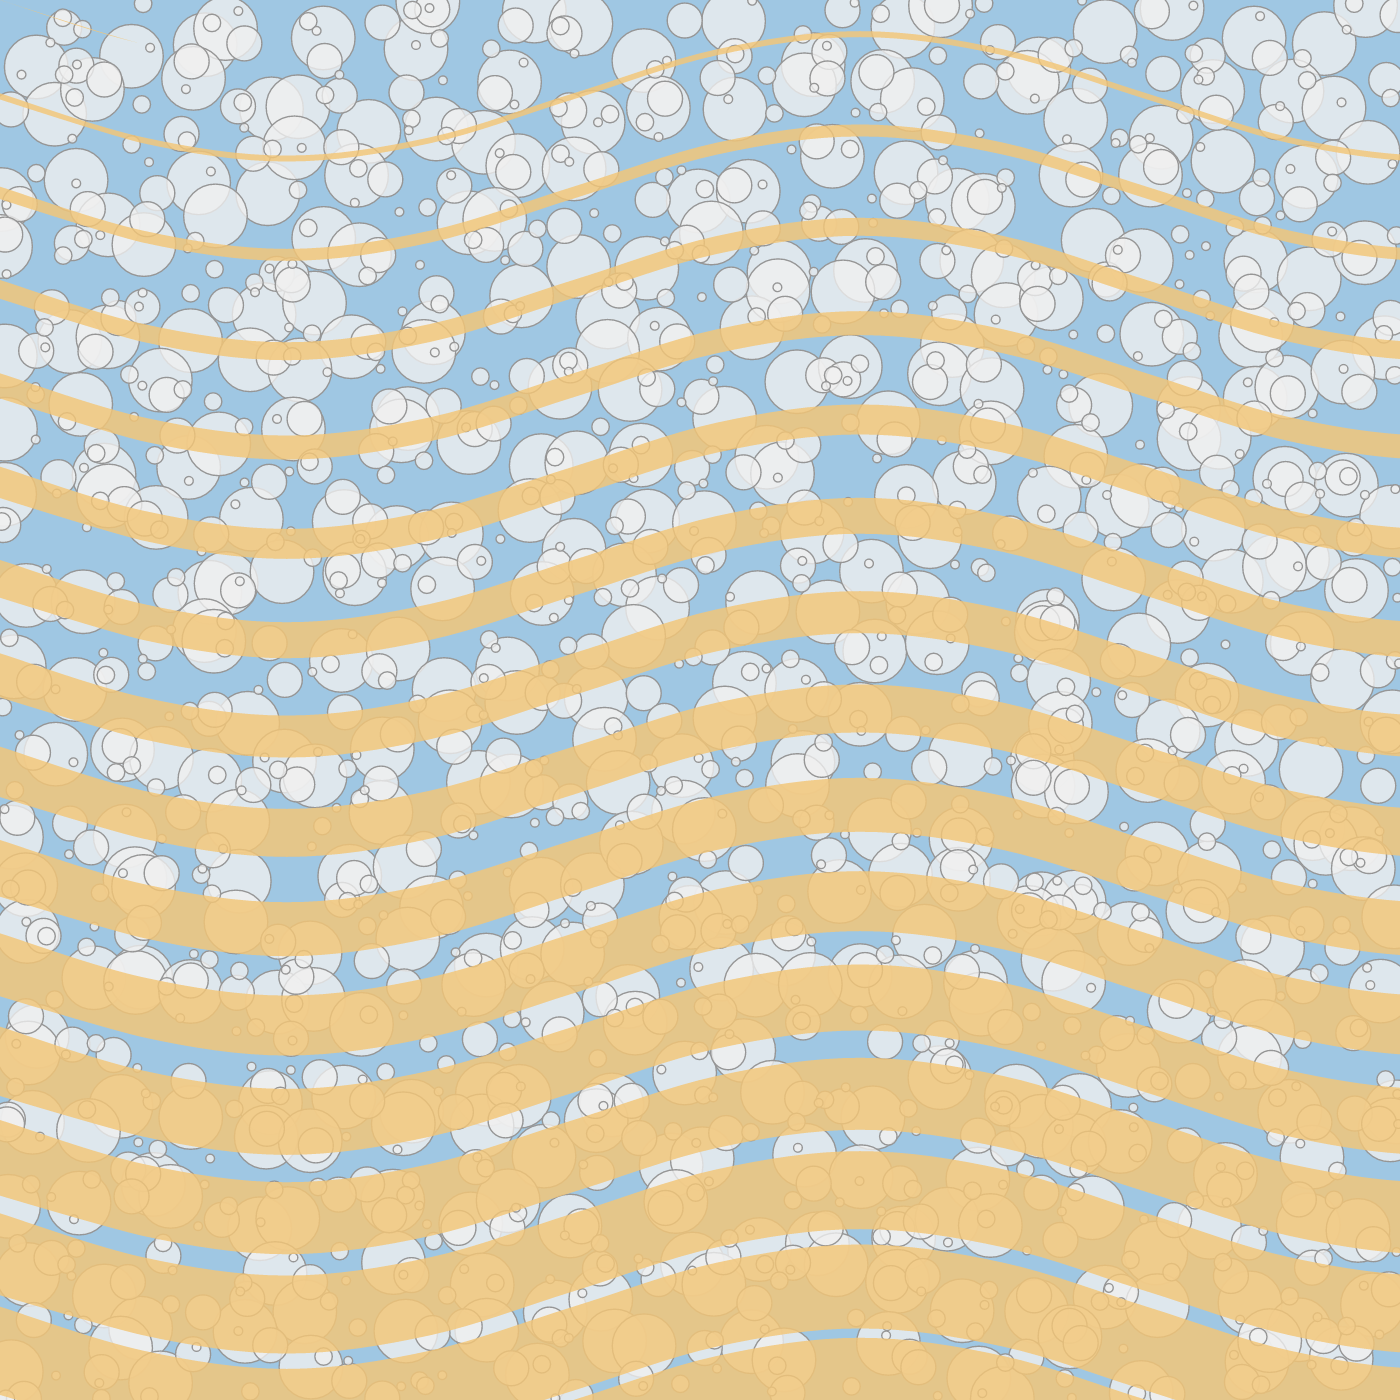
By the end of March, lockdown had arrived and I was starting to get to the point where I was making generative artworks that I actually quite liked. An early success was Beachside, which has a lovely summery vibe. "I think this is the first piece I've made that I could see myself printing out and putting on the wall," I wrote. I haven't done that yet, but honestly, I still like it enough that I would.
I also learnt how to use Perlin Noise and created a piece called Mountain Drive that I described as a "driving through New Mexico at night simulator". It generates a series of mountain ridges with a parallax effect, as stars spin overhead. It's infinite - you can drive forever.
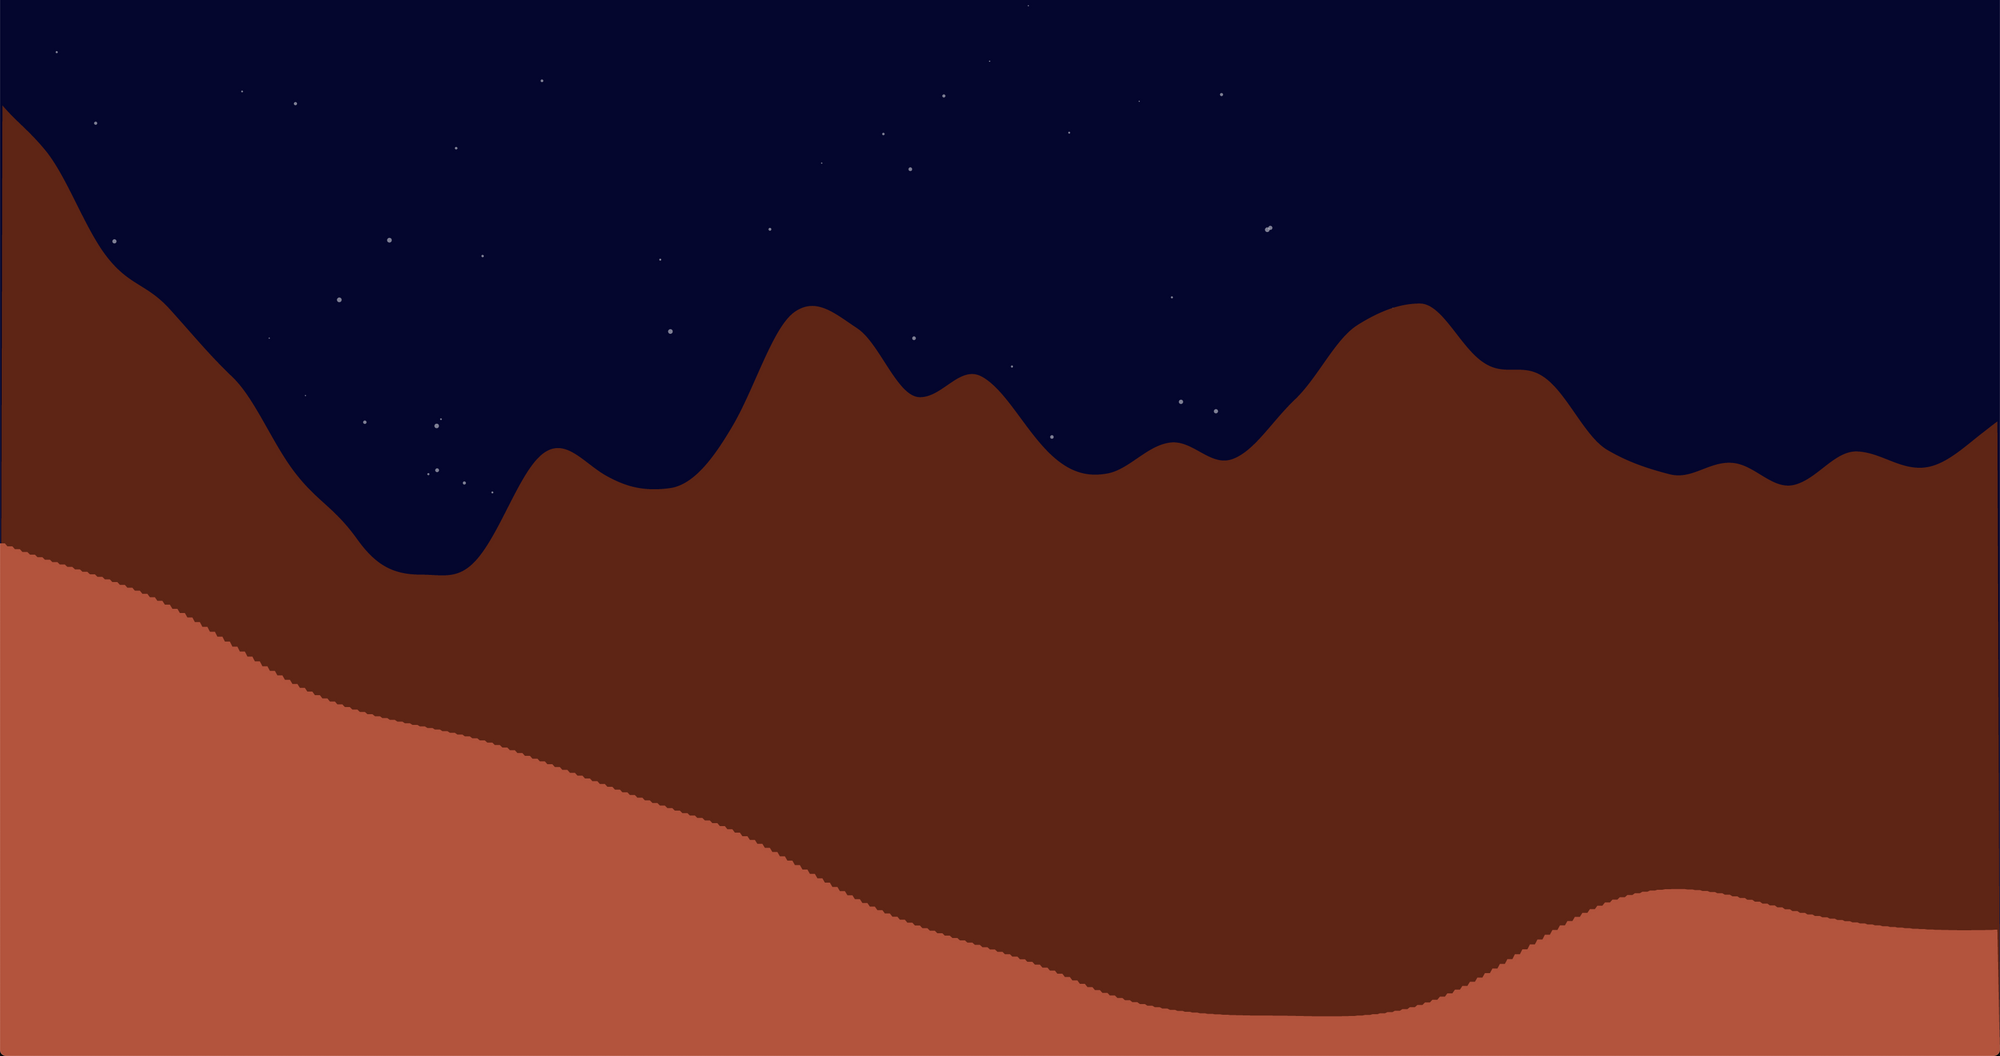
I really like both of these pieces because they conjure up a strong sense of place and mood that I find is missing from a lot of generative artwork.
I still wanted a pen plotter desperately, but I wasn't sure if I could justify the not-inconsiderable expense, and I knew that I needed to build the skills to make the most of the investment. So I made myself a deal. Every time I made a generative art sketch, I would deposit €10 into a savings account. Fifty sketches later, I'd have enough saved for a pen plotter.
This lasted a while, but then I sold some old camera equipment that was hanging around and suddenly I had some spare cash. On 4 April I ordered the plotter. On 9 April it arrived, just in time for the Easter weekend.
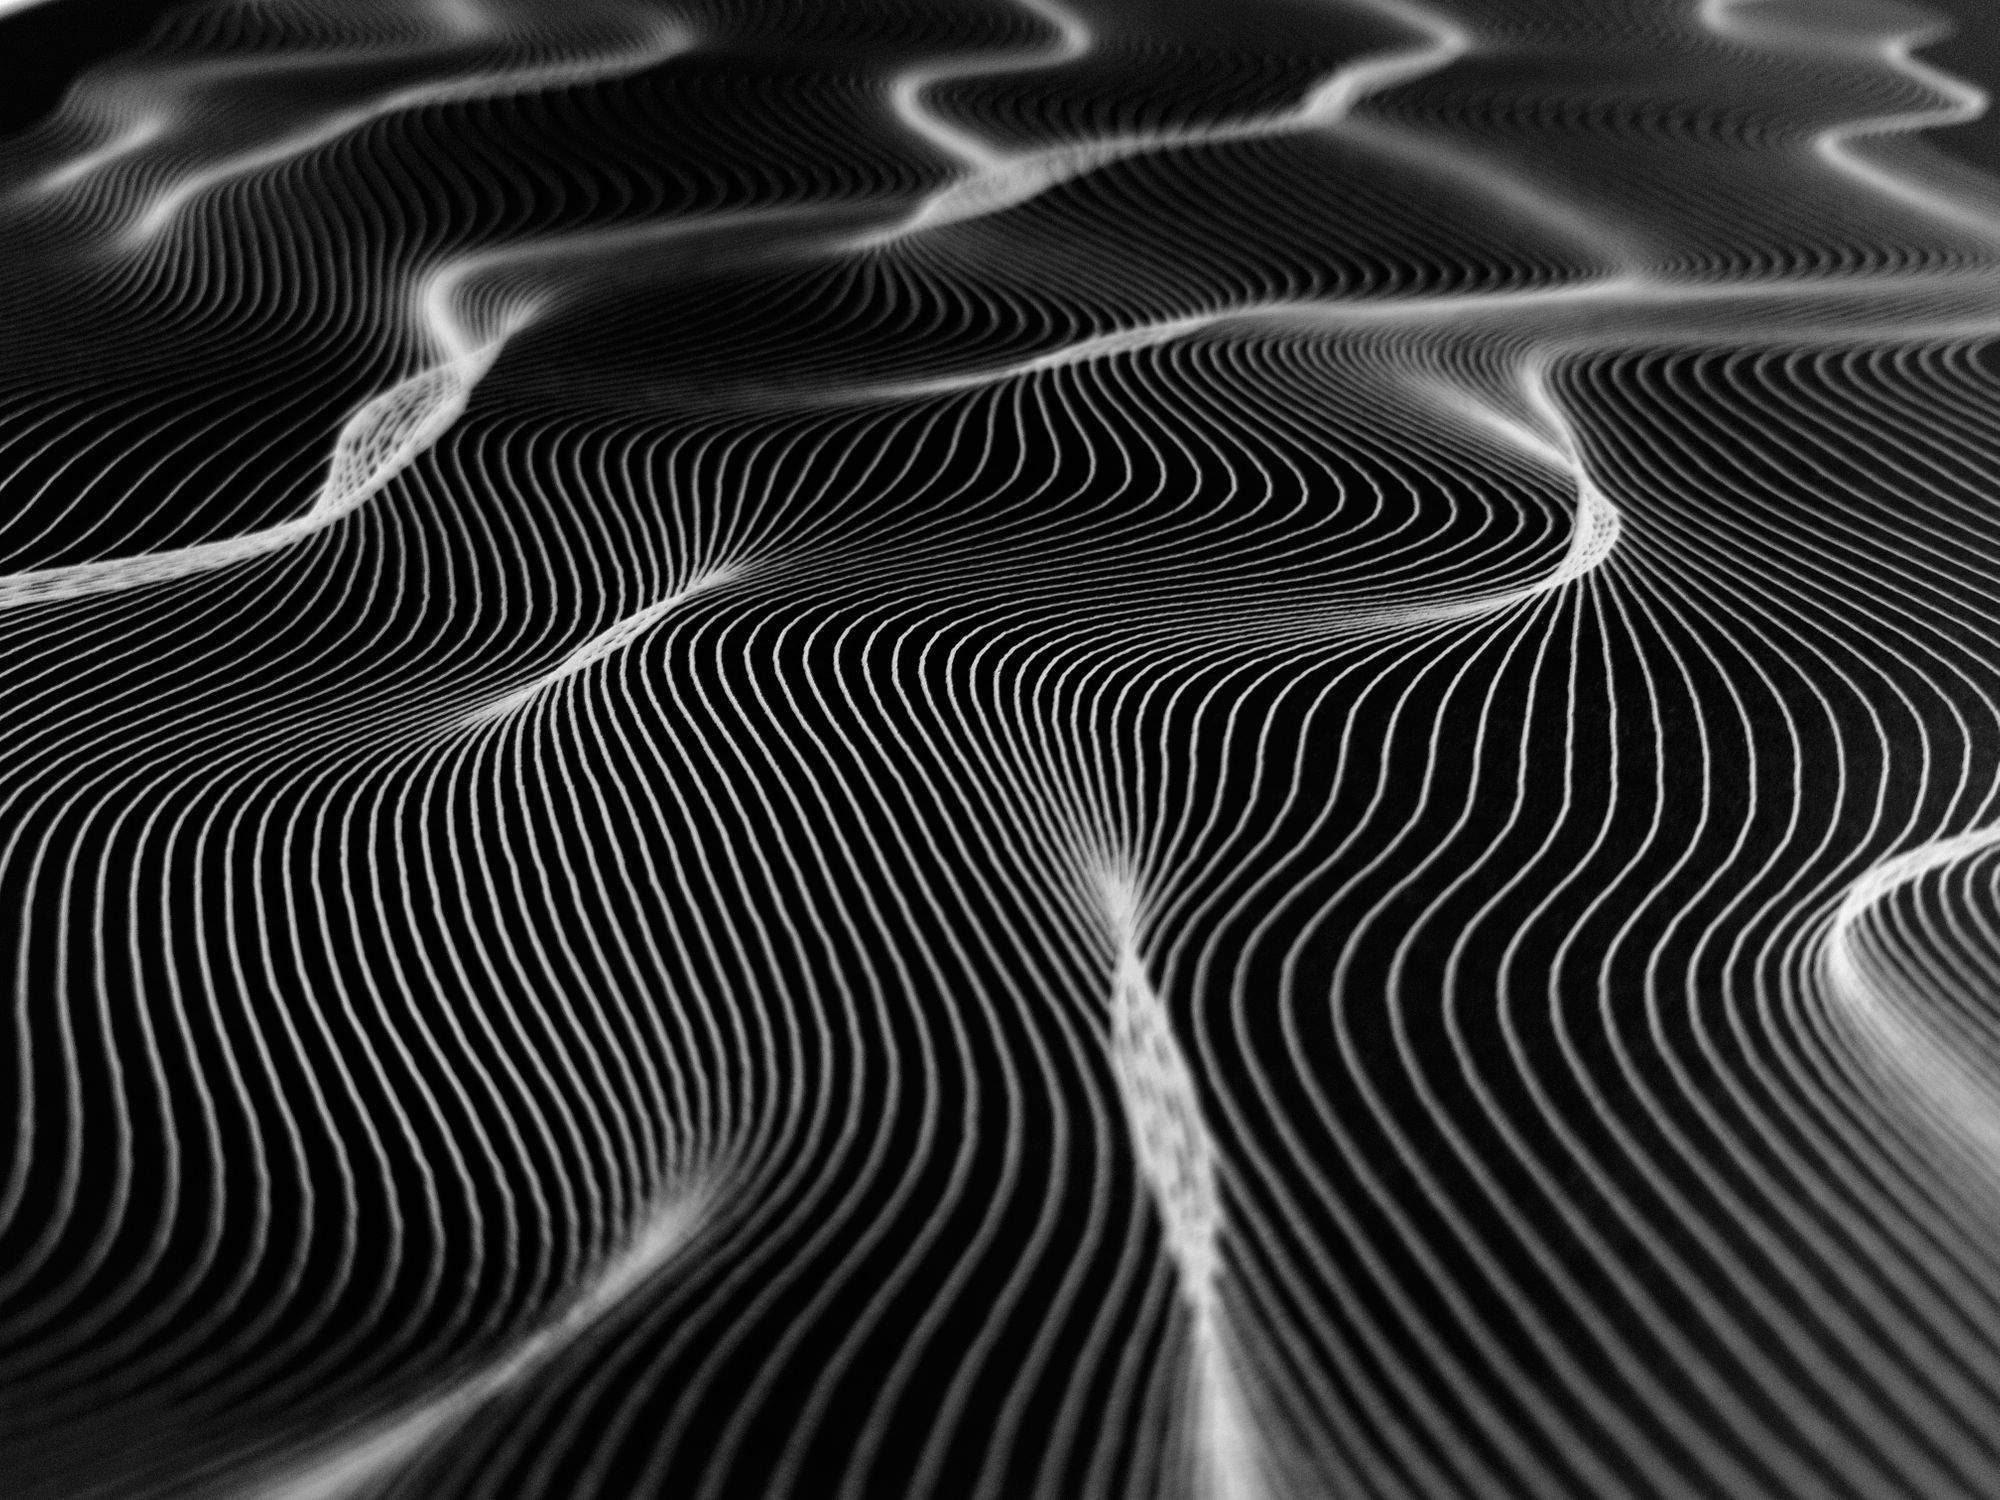
By the end of the weekend, I'd done a lot of plotting, spent far too much on pens and paper, and discovered that p5 doesn't output SVG - meaning that I'd have to learn an entirely new library to write my own generative art code. Damn.
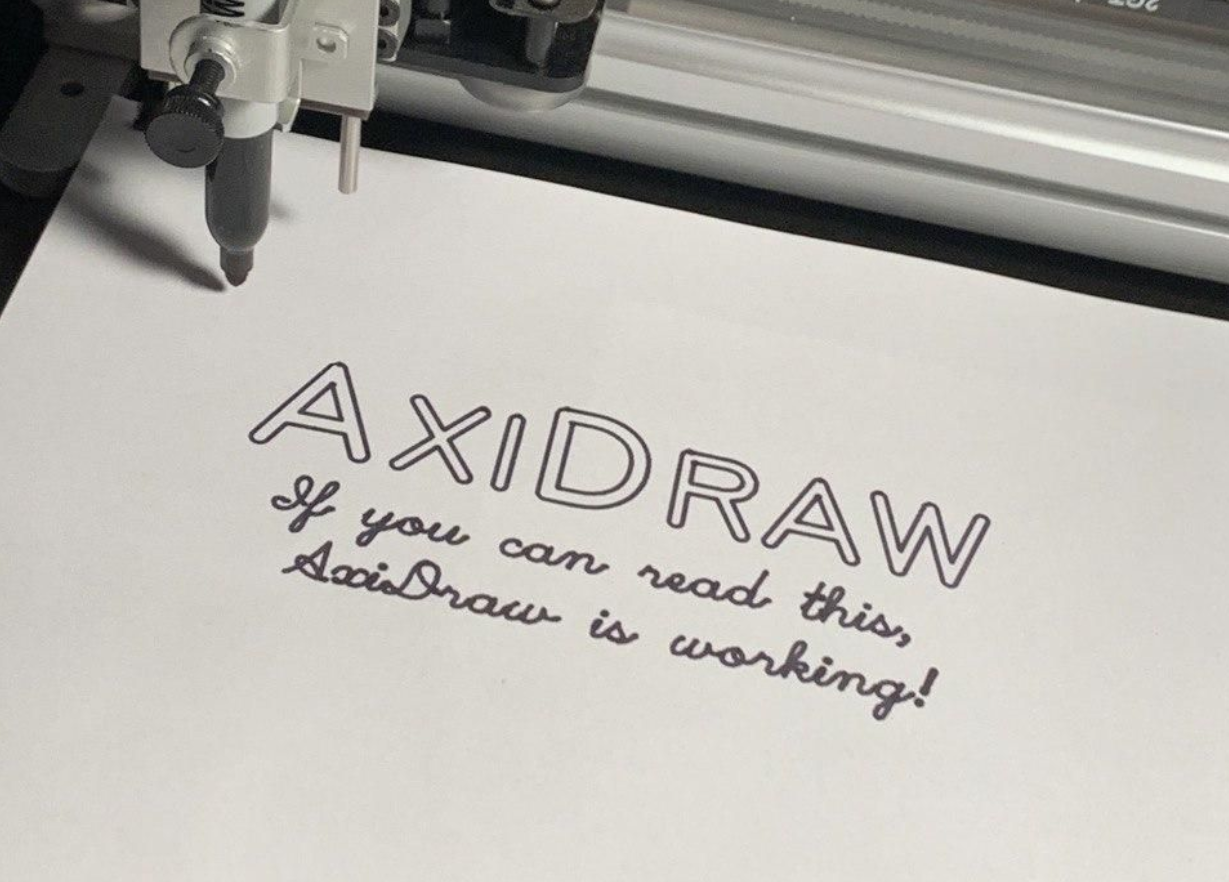
I had made some preparations in advance of the plotter arriving, registering a YouTube channel to use to share footage of the plotter doing its thing. I posted an unboxing video when the plotter arrived, and the channel now has almost 500 subscribers. The videos (which are expertly edited and produced by my partner Silfa) average a few hundred views each, which I'm pretty happy with considering that we've not really been putting that much effort into the channel.
One of the most fun things that we do on a regular basis is a real-time stream where the plotter draws a complex and detailed image over the course of a few hours, with lo-fi music playing in the background. We call these "chillplots", and the idea is that people can tune in and watch the robot doing its thing while they work or do something else. Slow TV.
Plottervision is also the home of Dataplotter - another of my crossover data/art experiments, which I wrote about in depth last time.
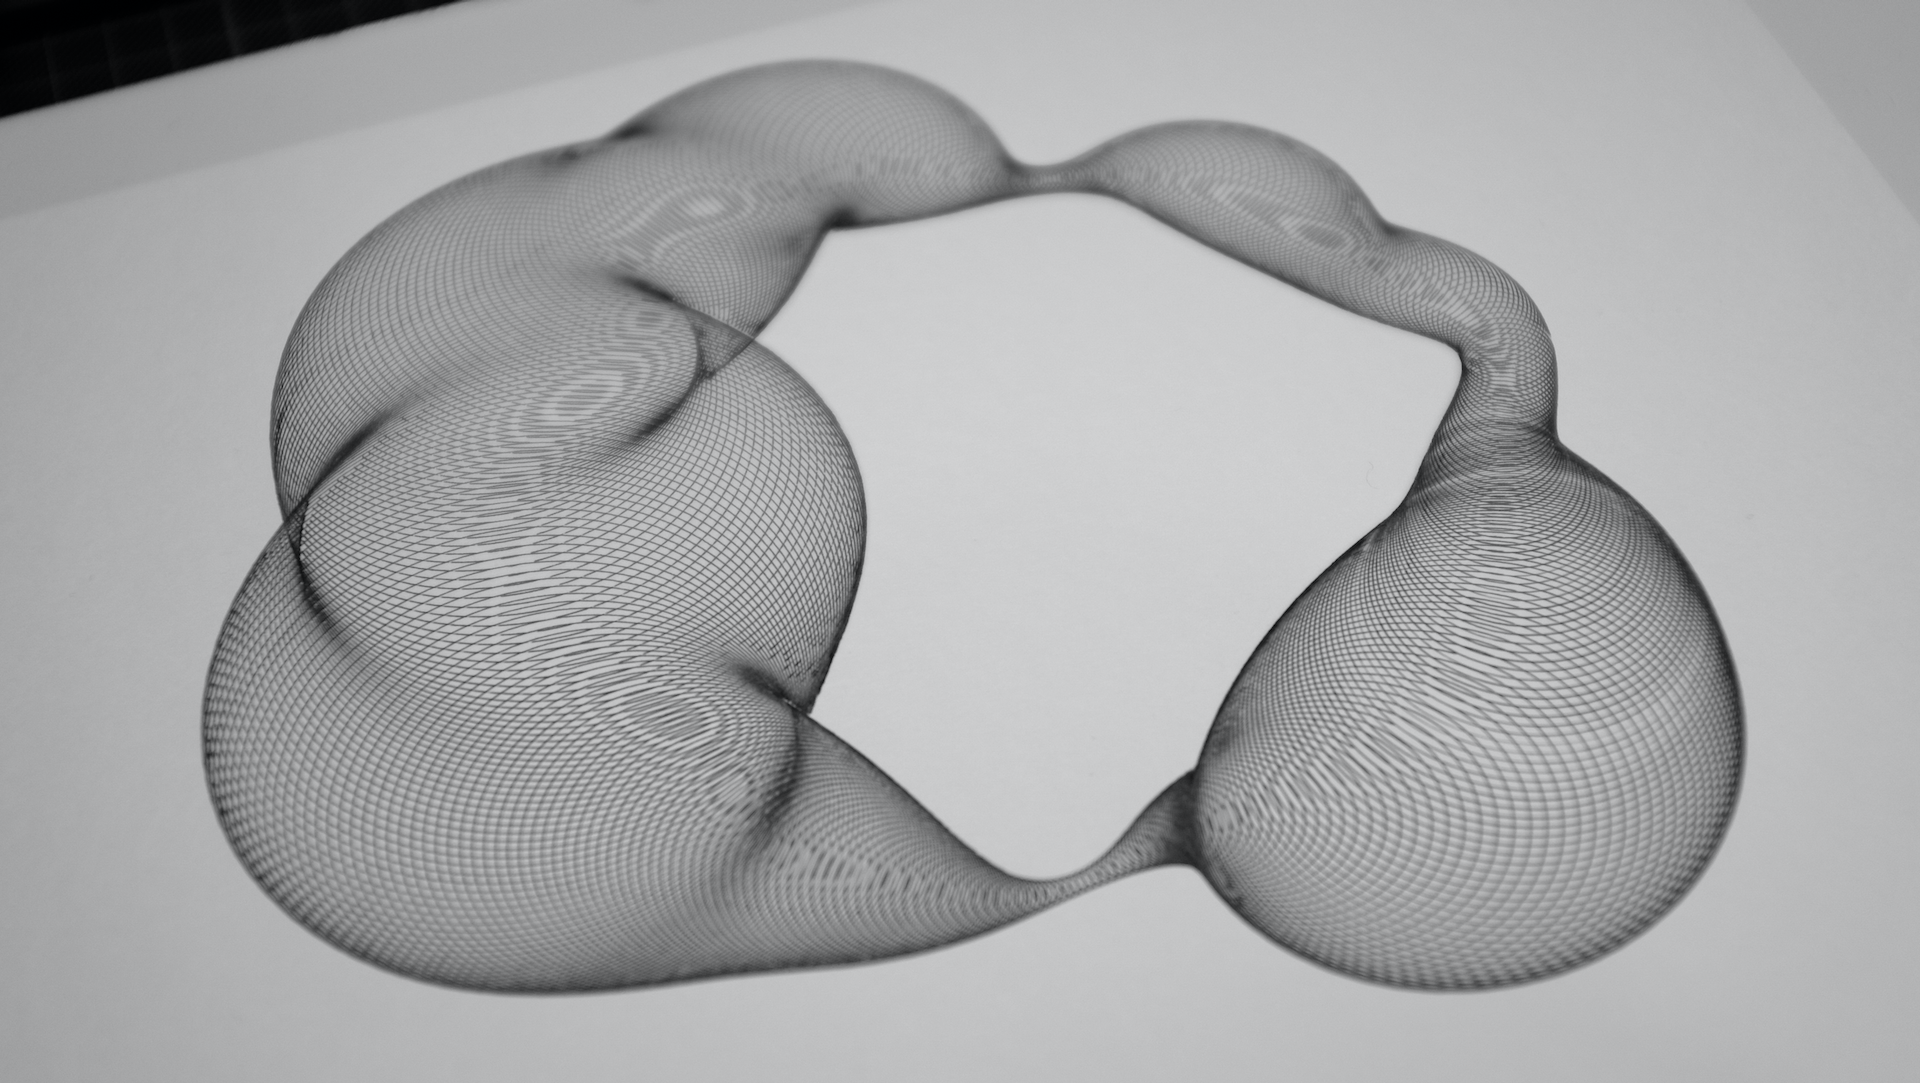
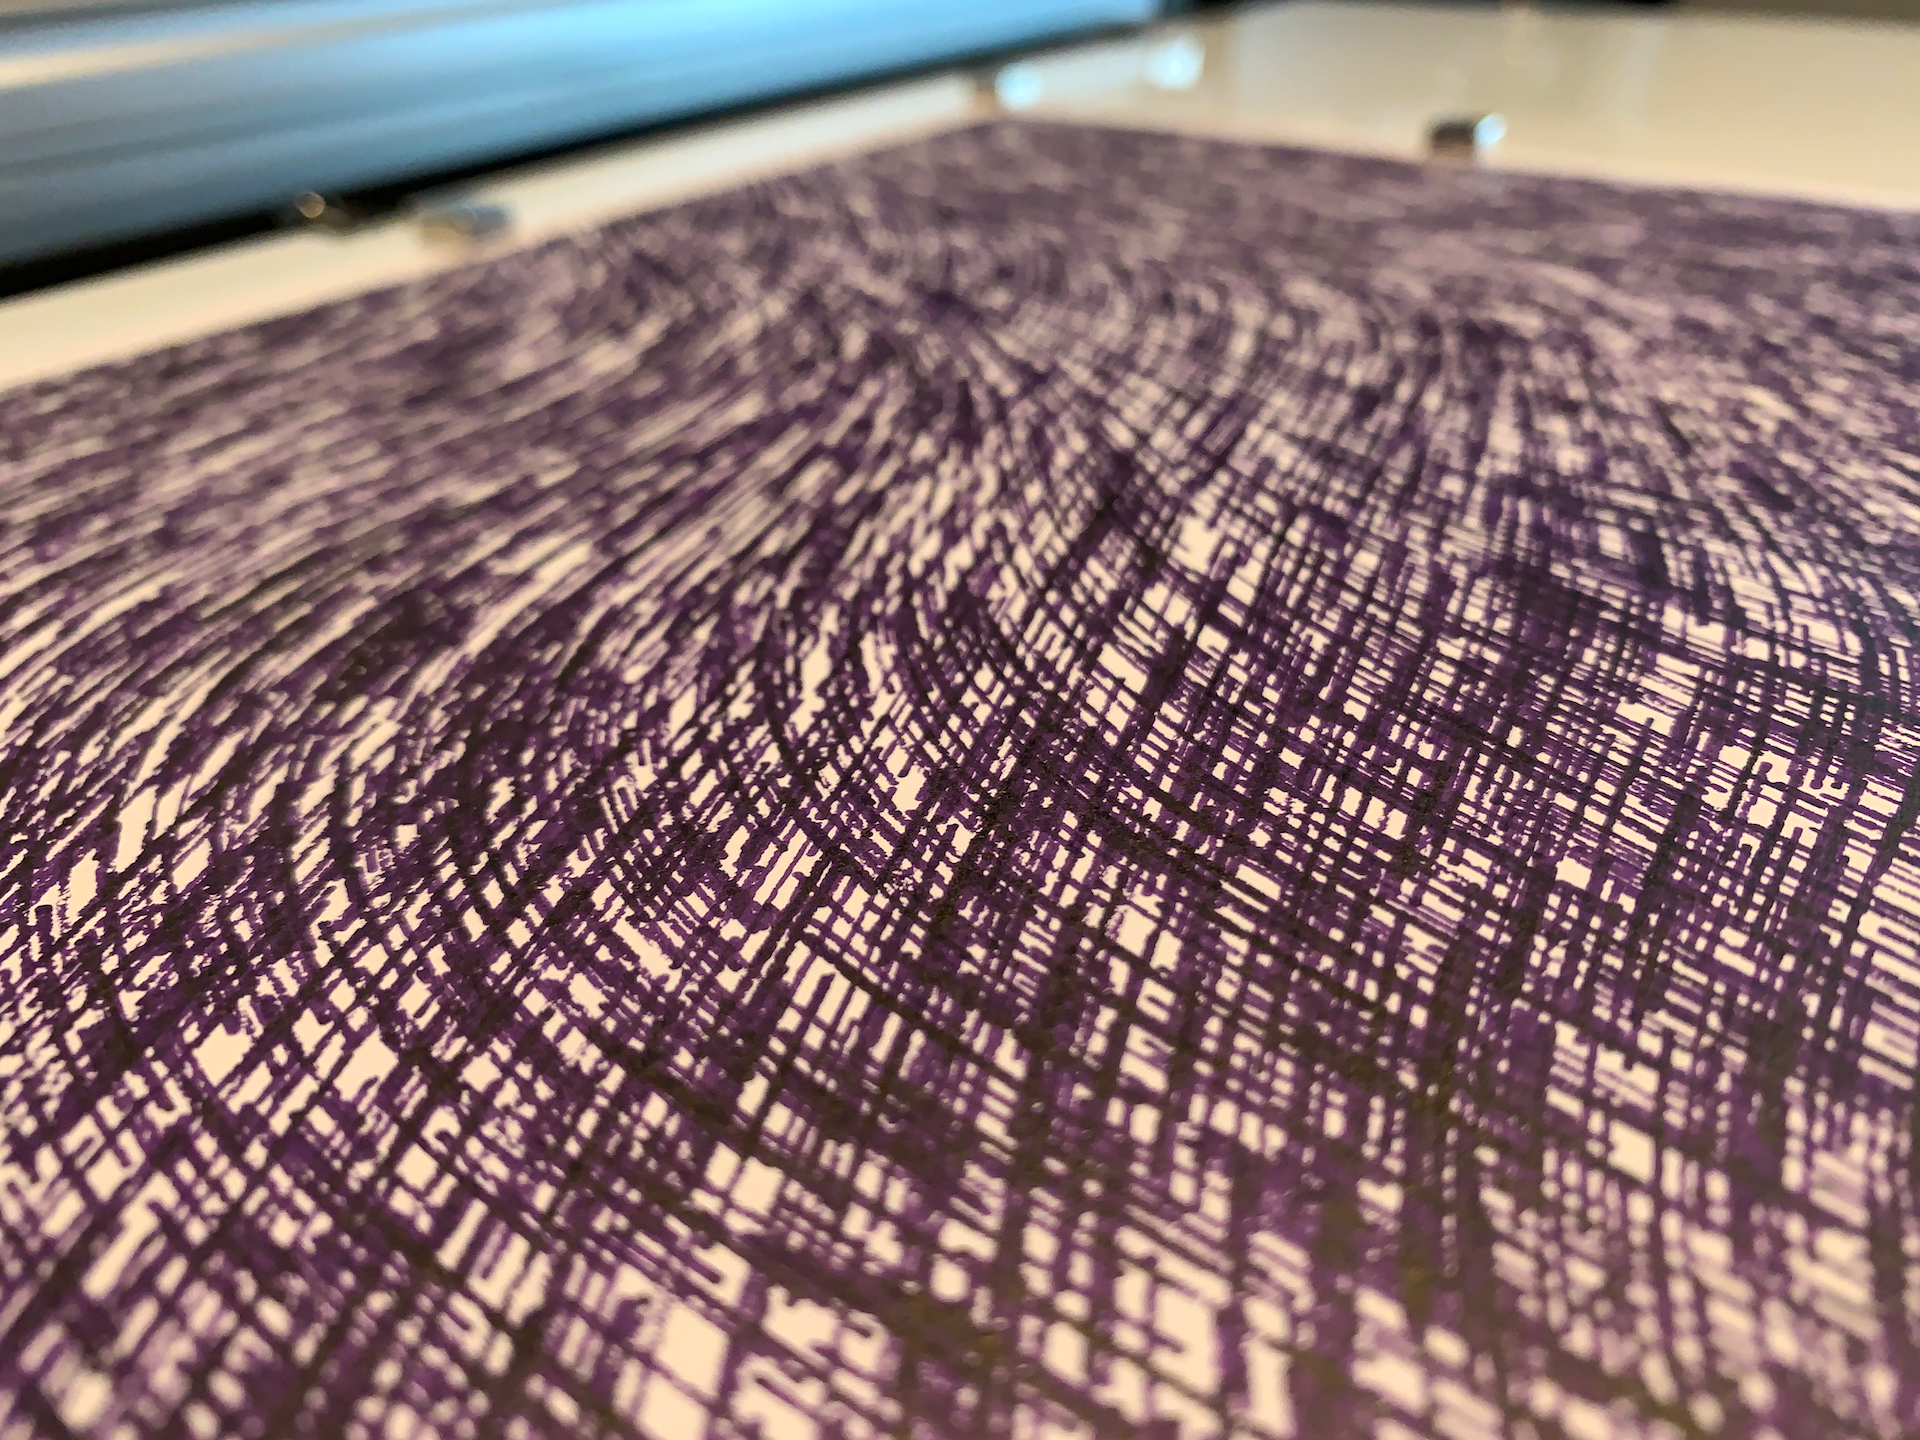
There were quite a lot of small pieces of generative work that I made over the course of the year that didn't really deserve a blog post in their own right, but were interesting to experiment with. Here's a gallery of those.
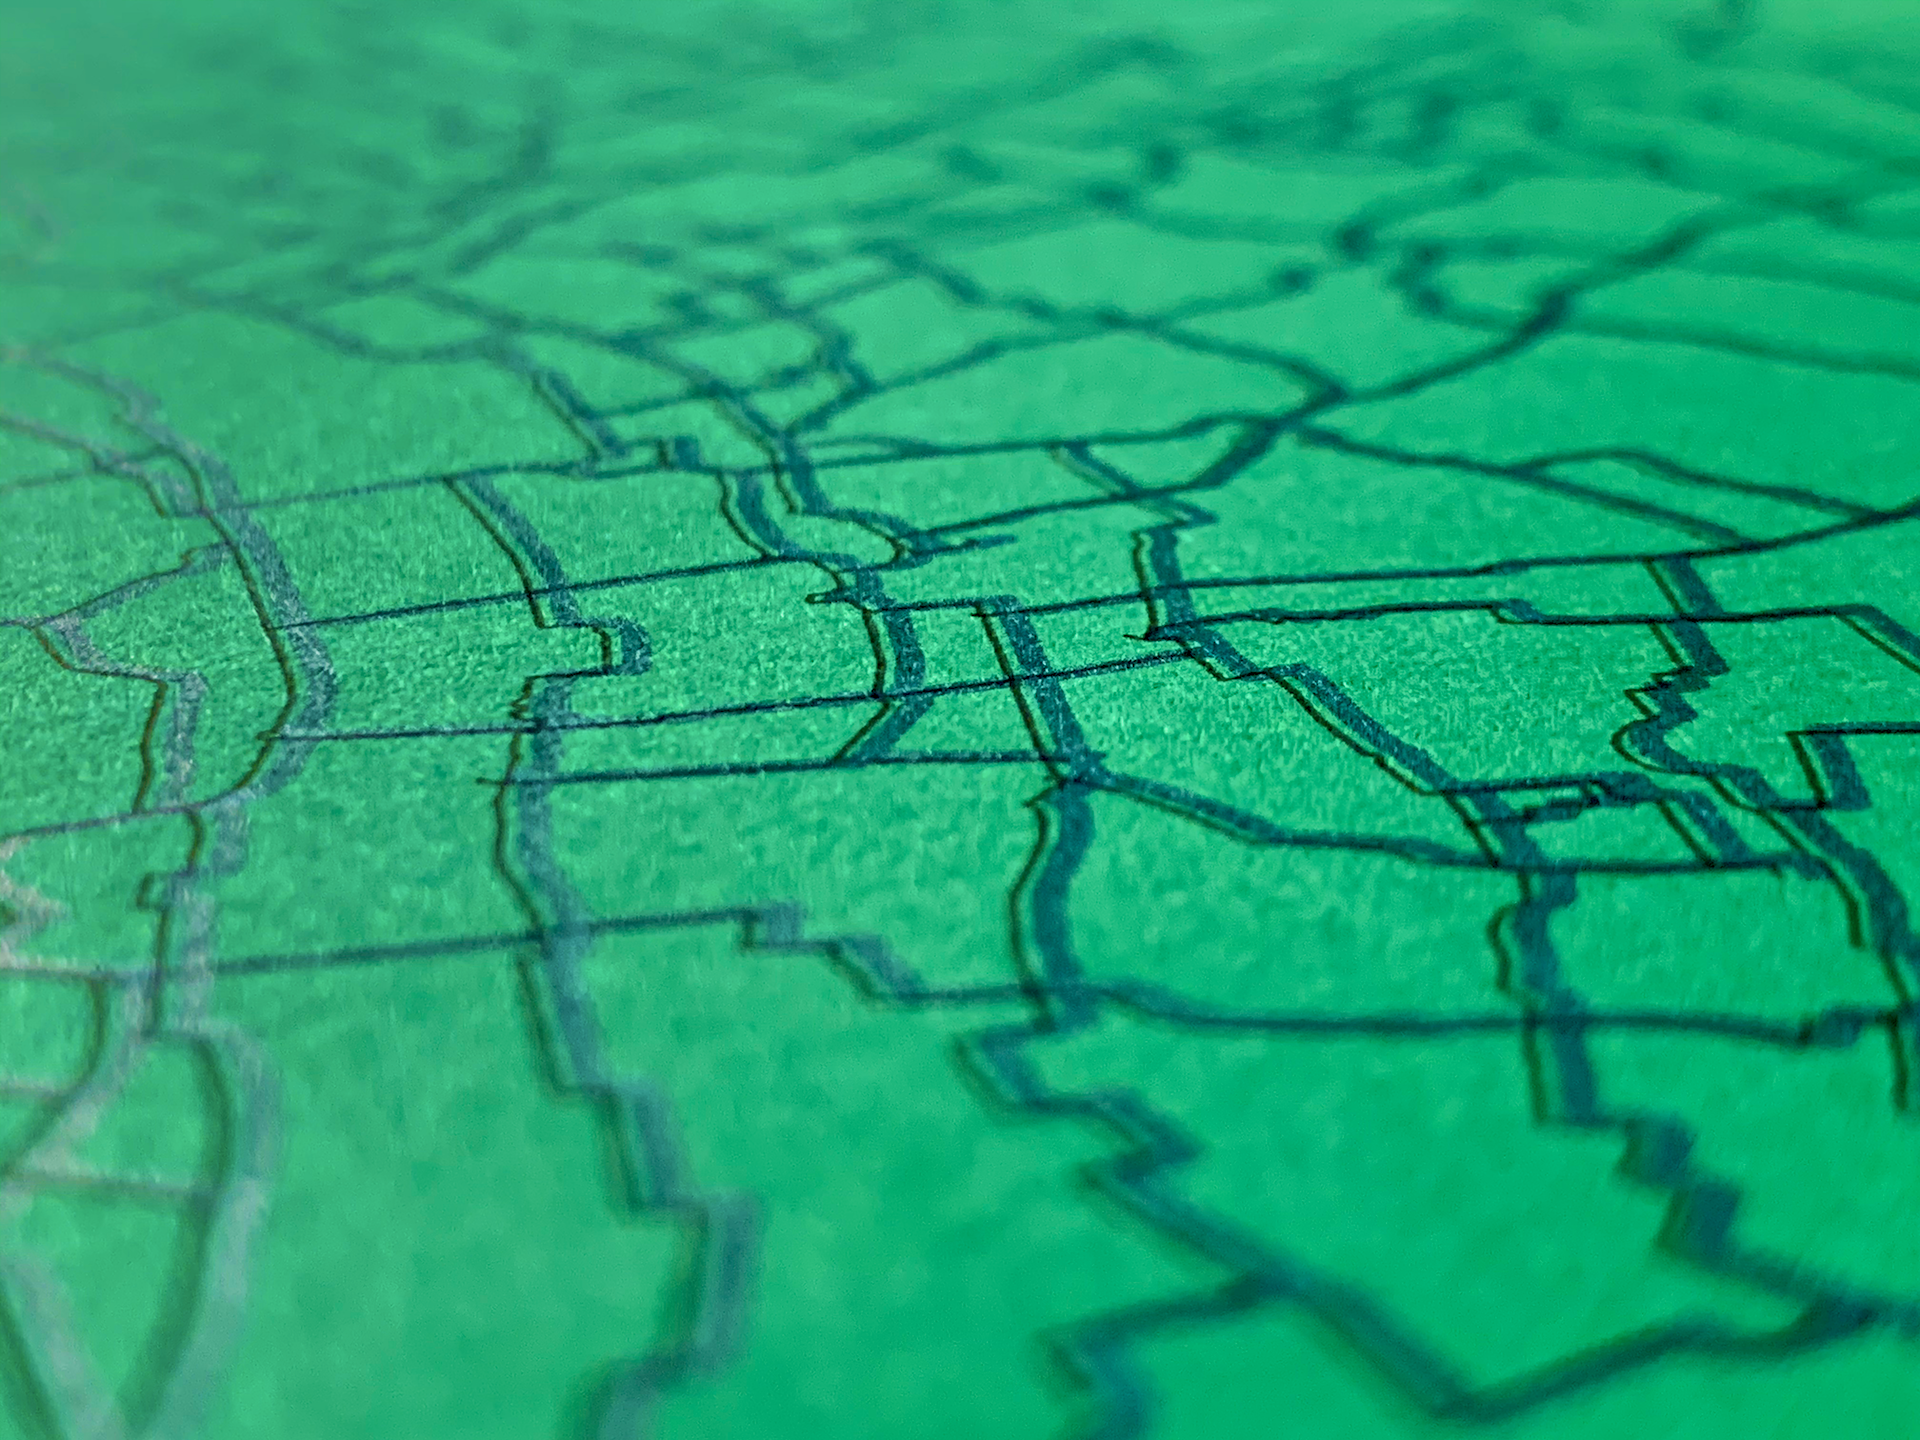
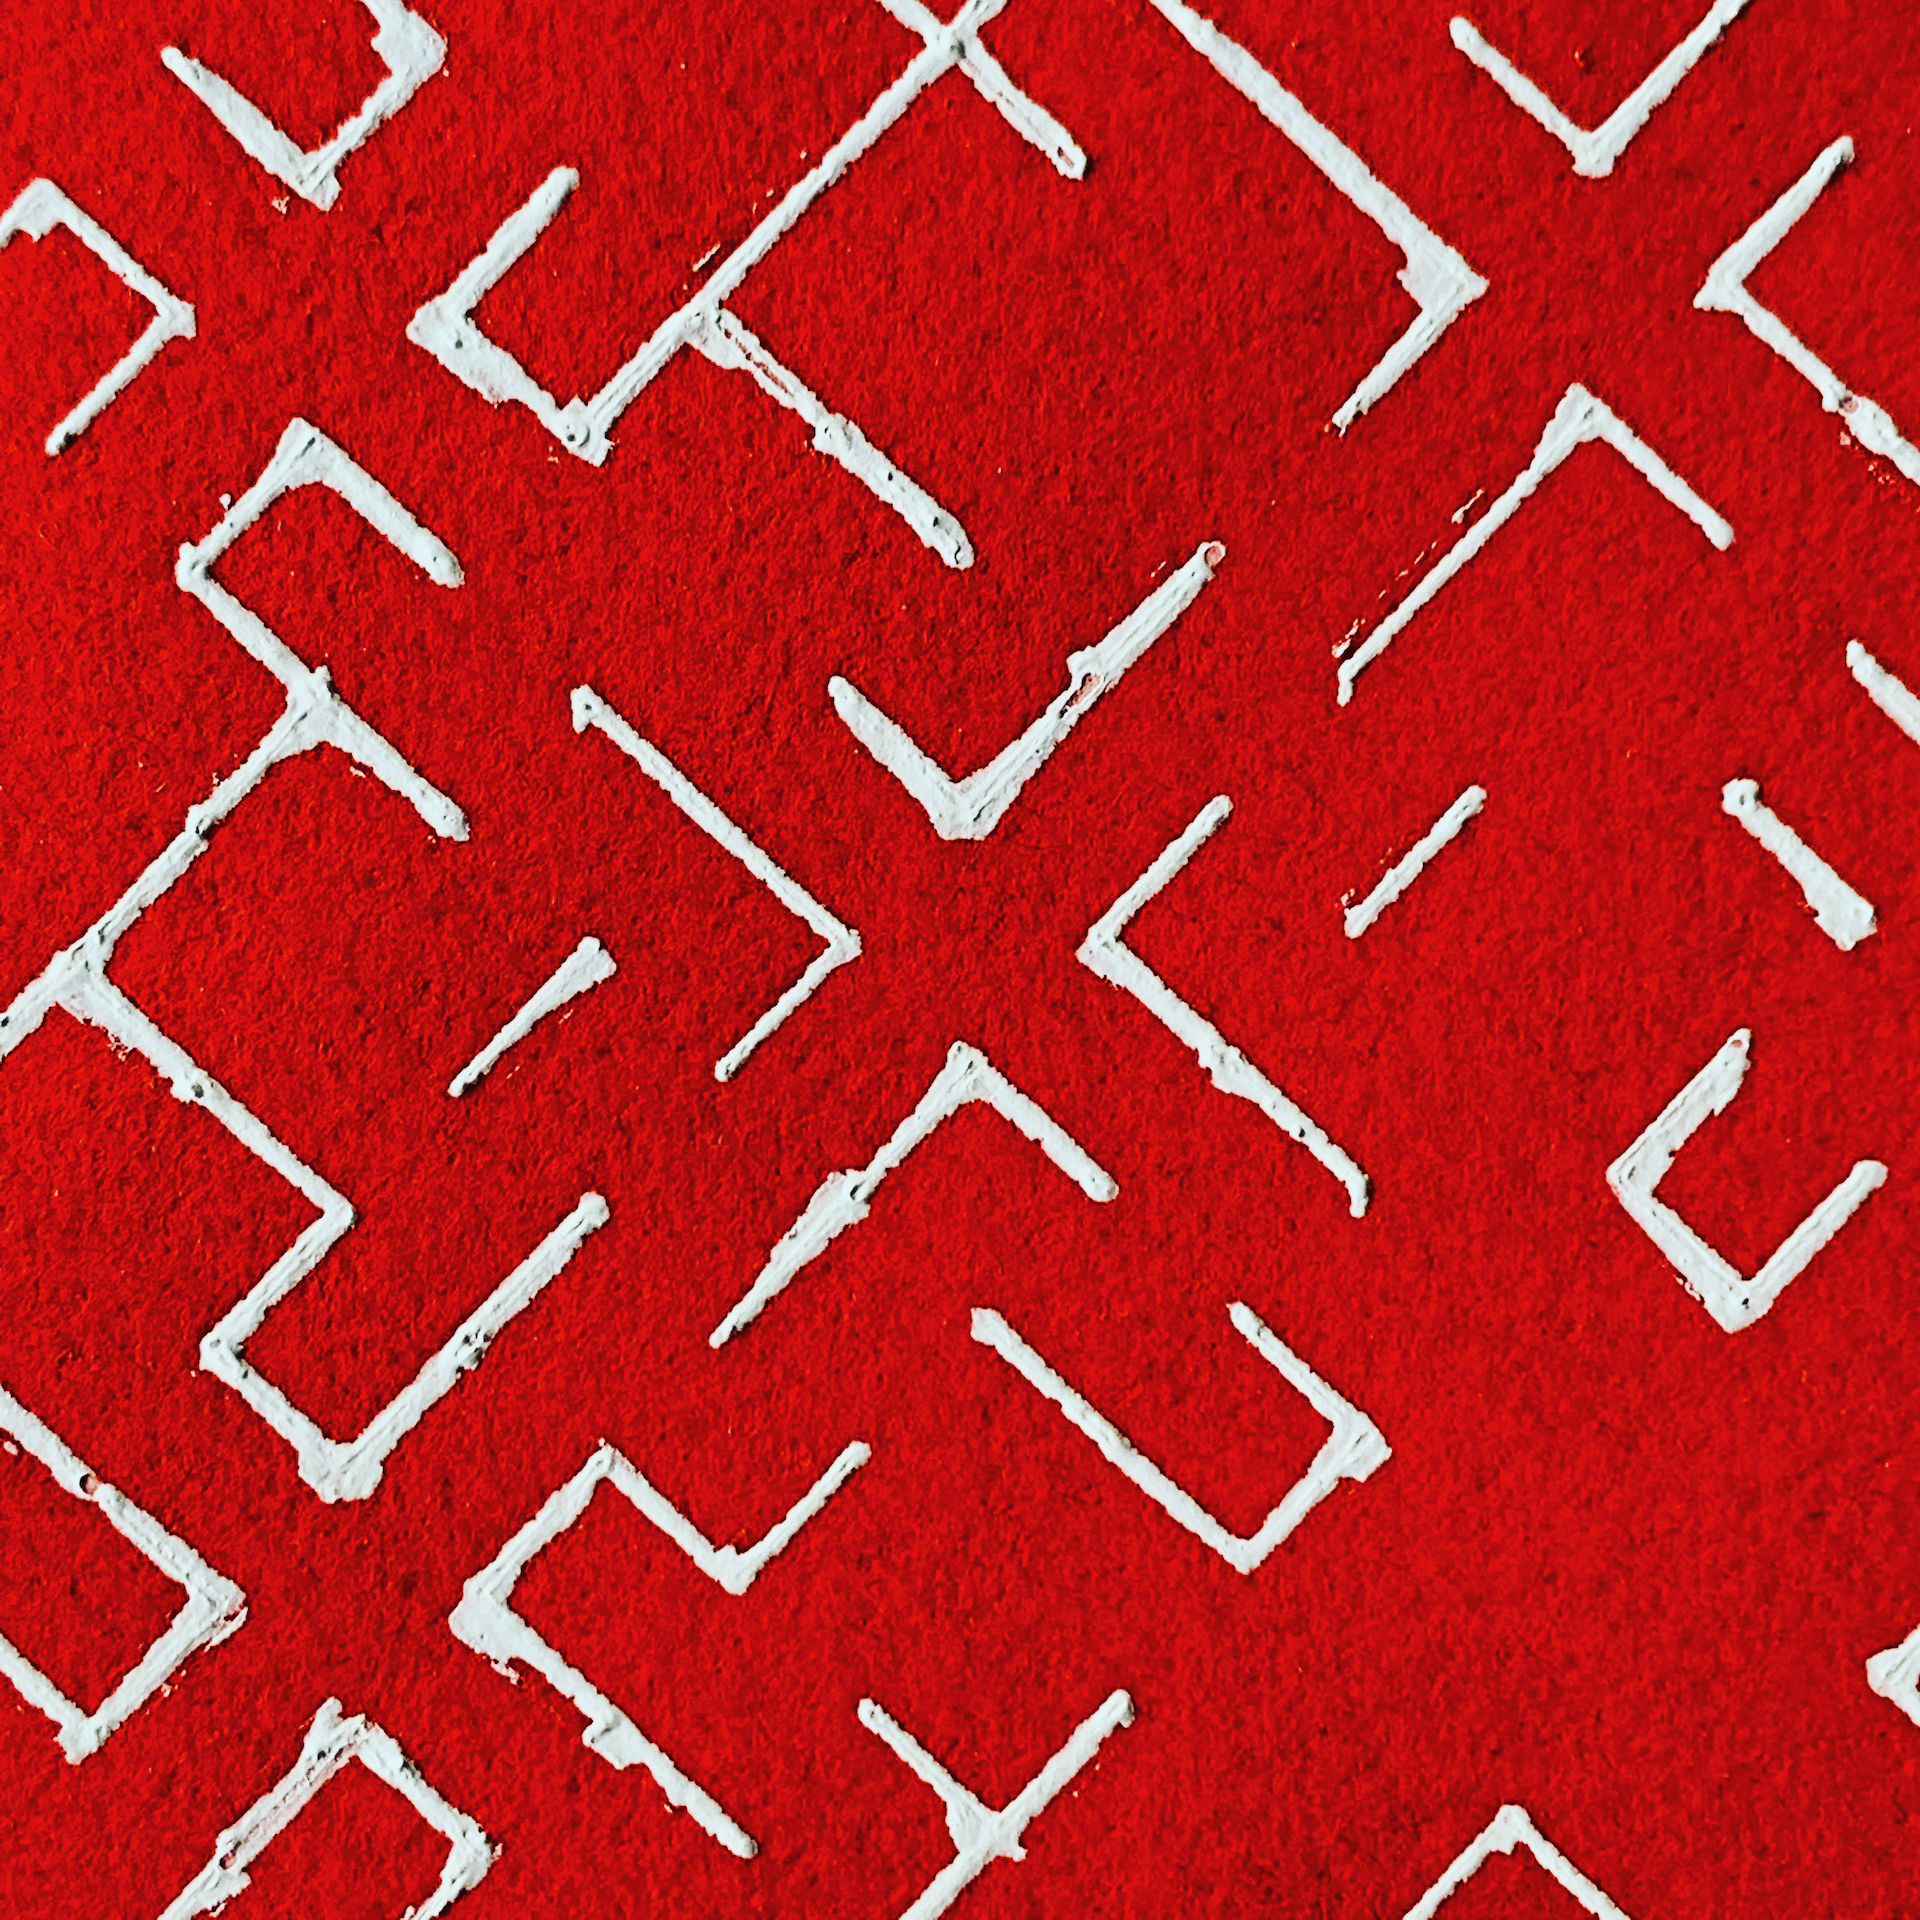
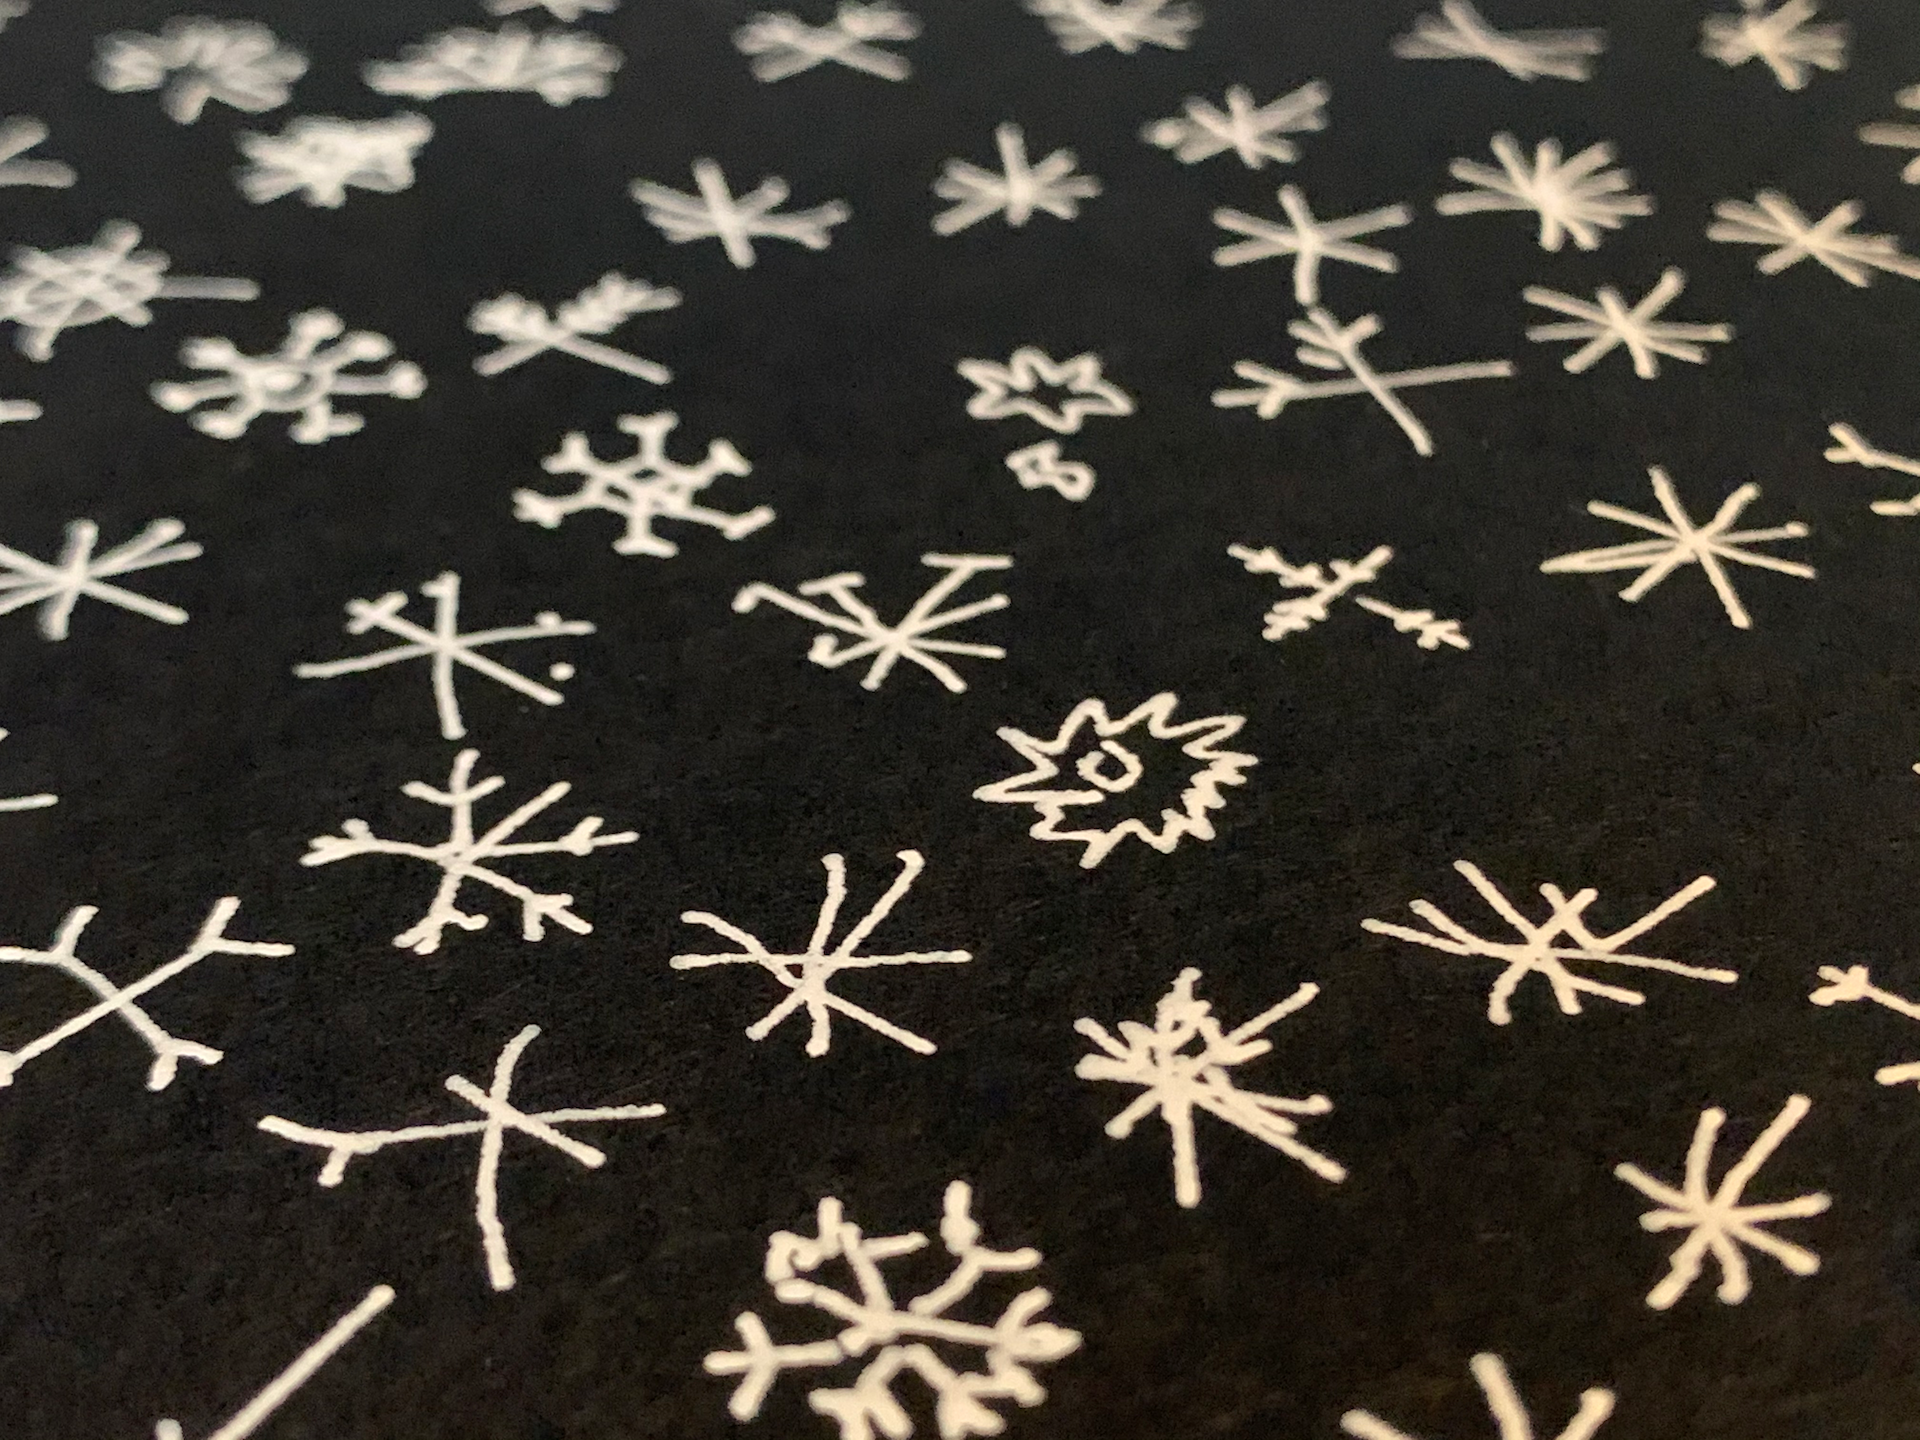
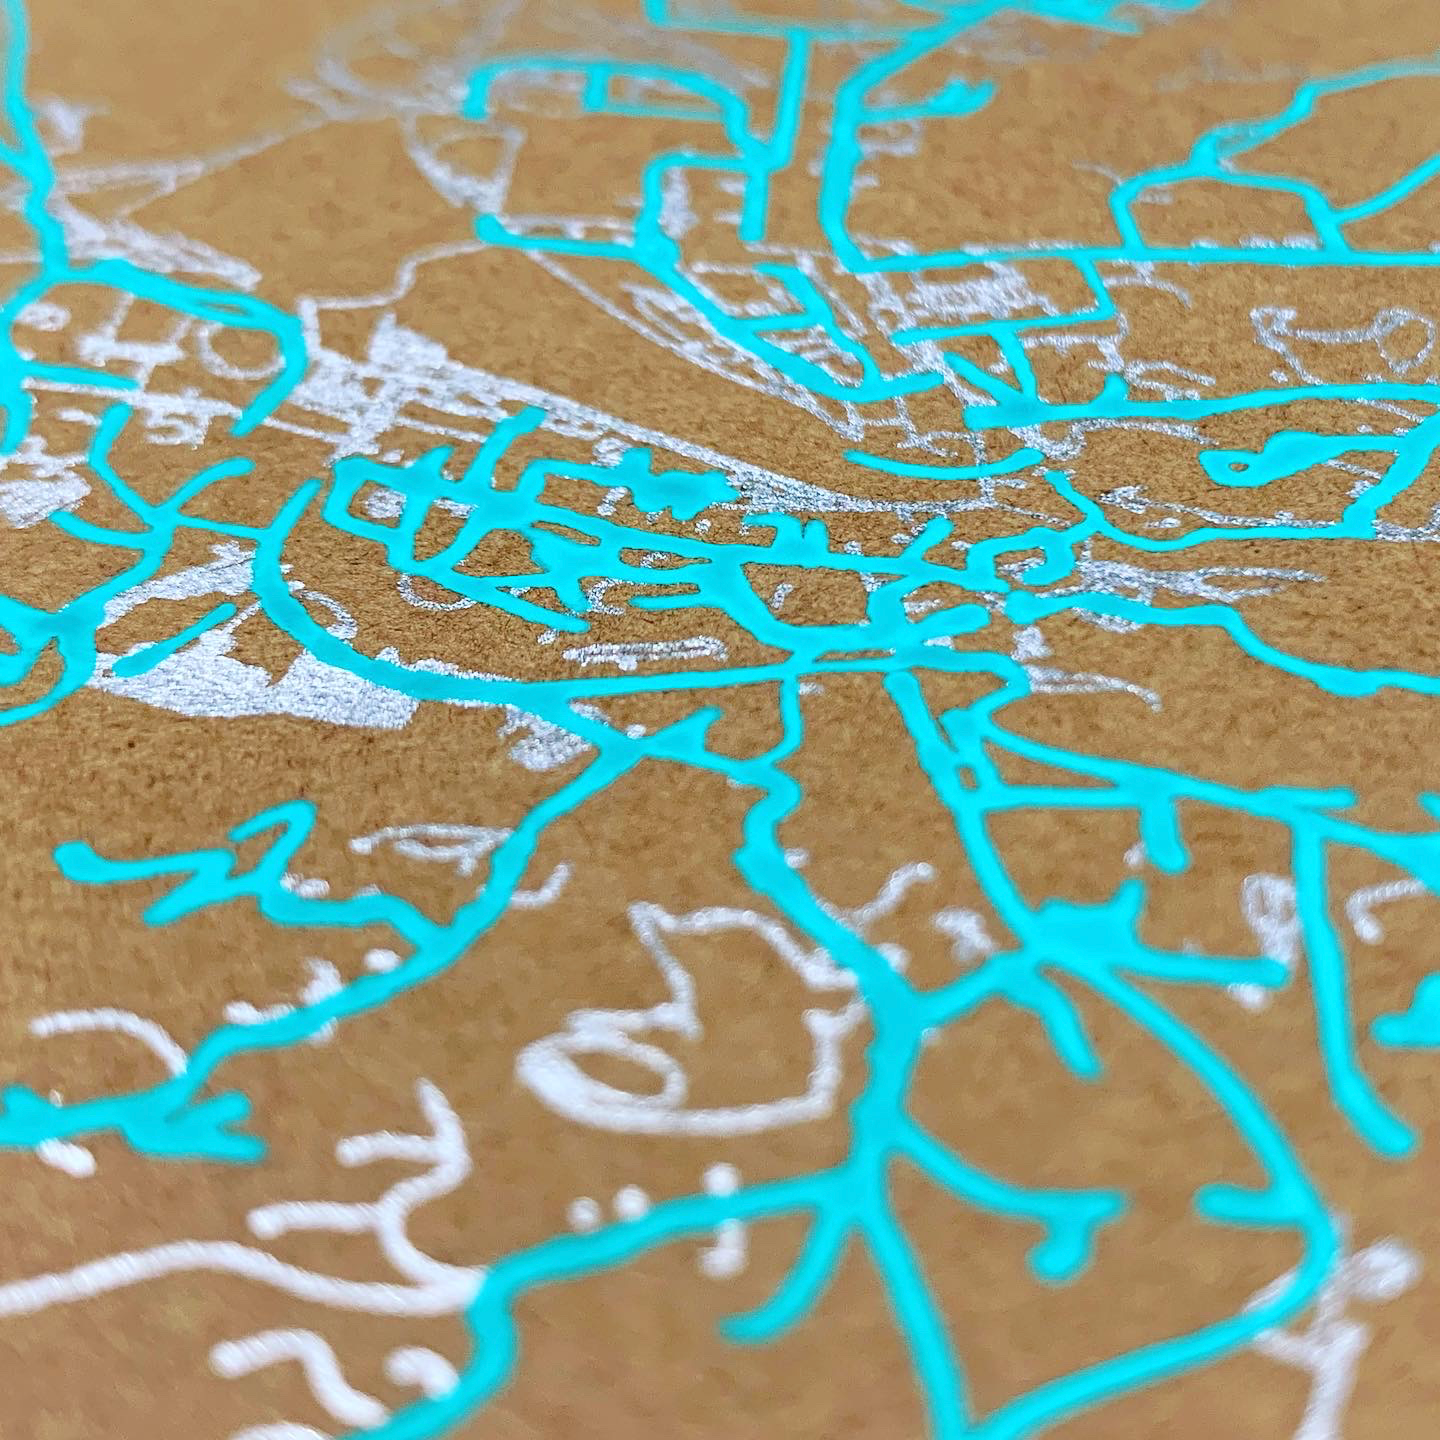
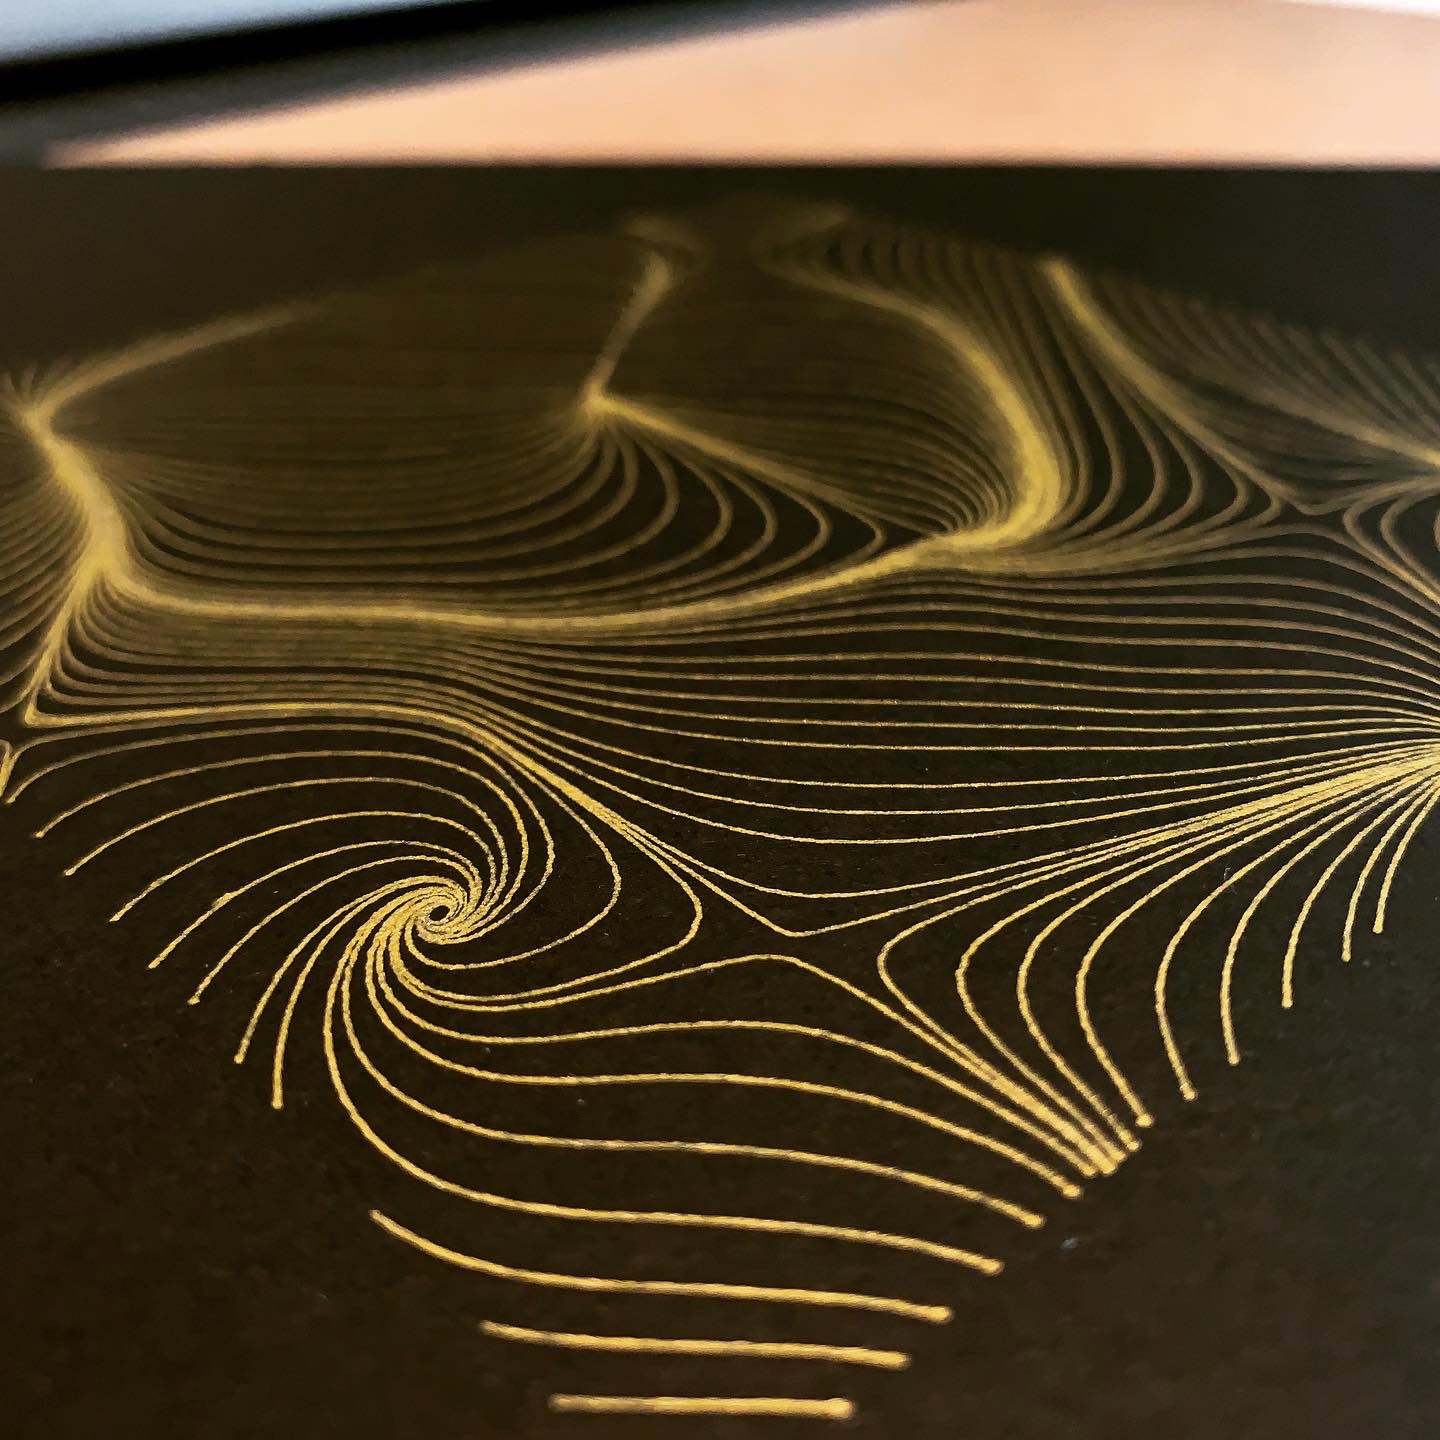
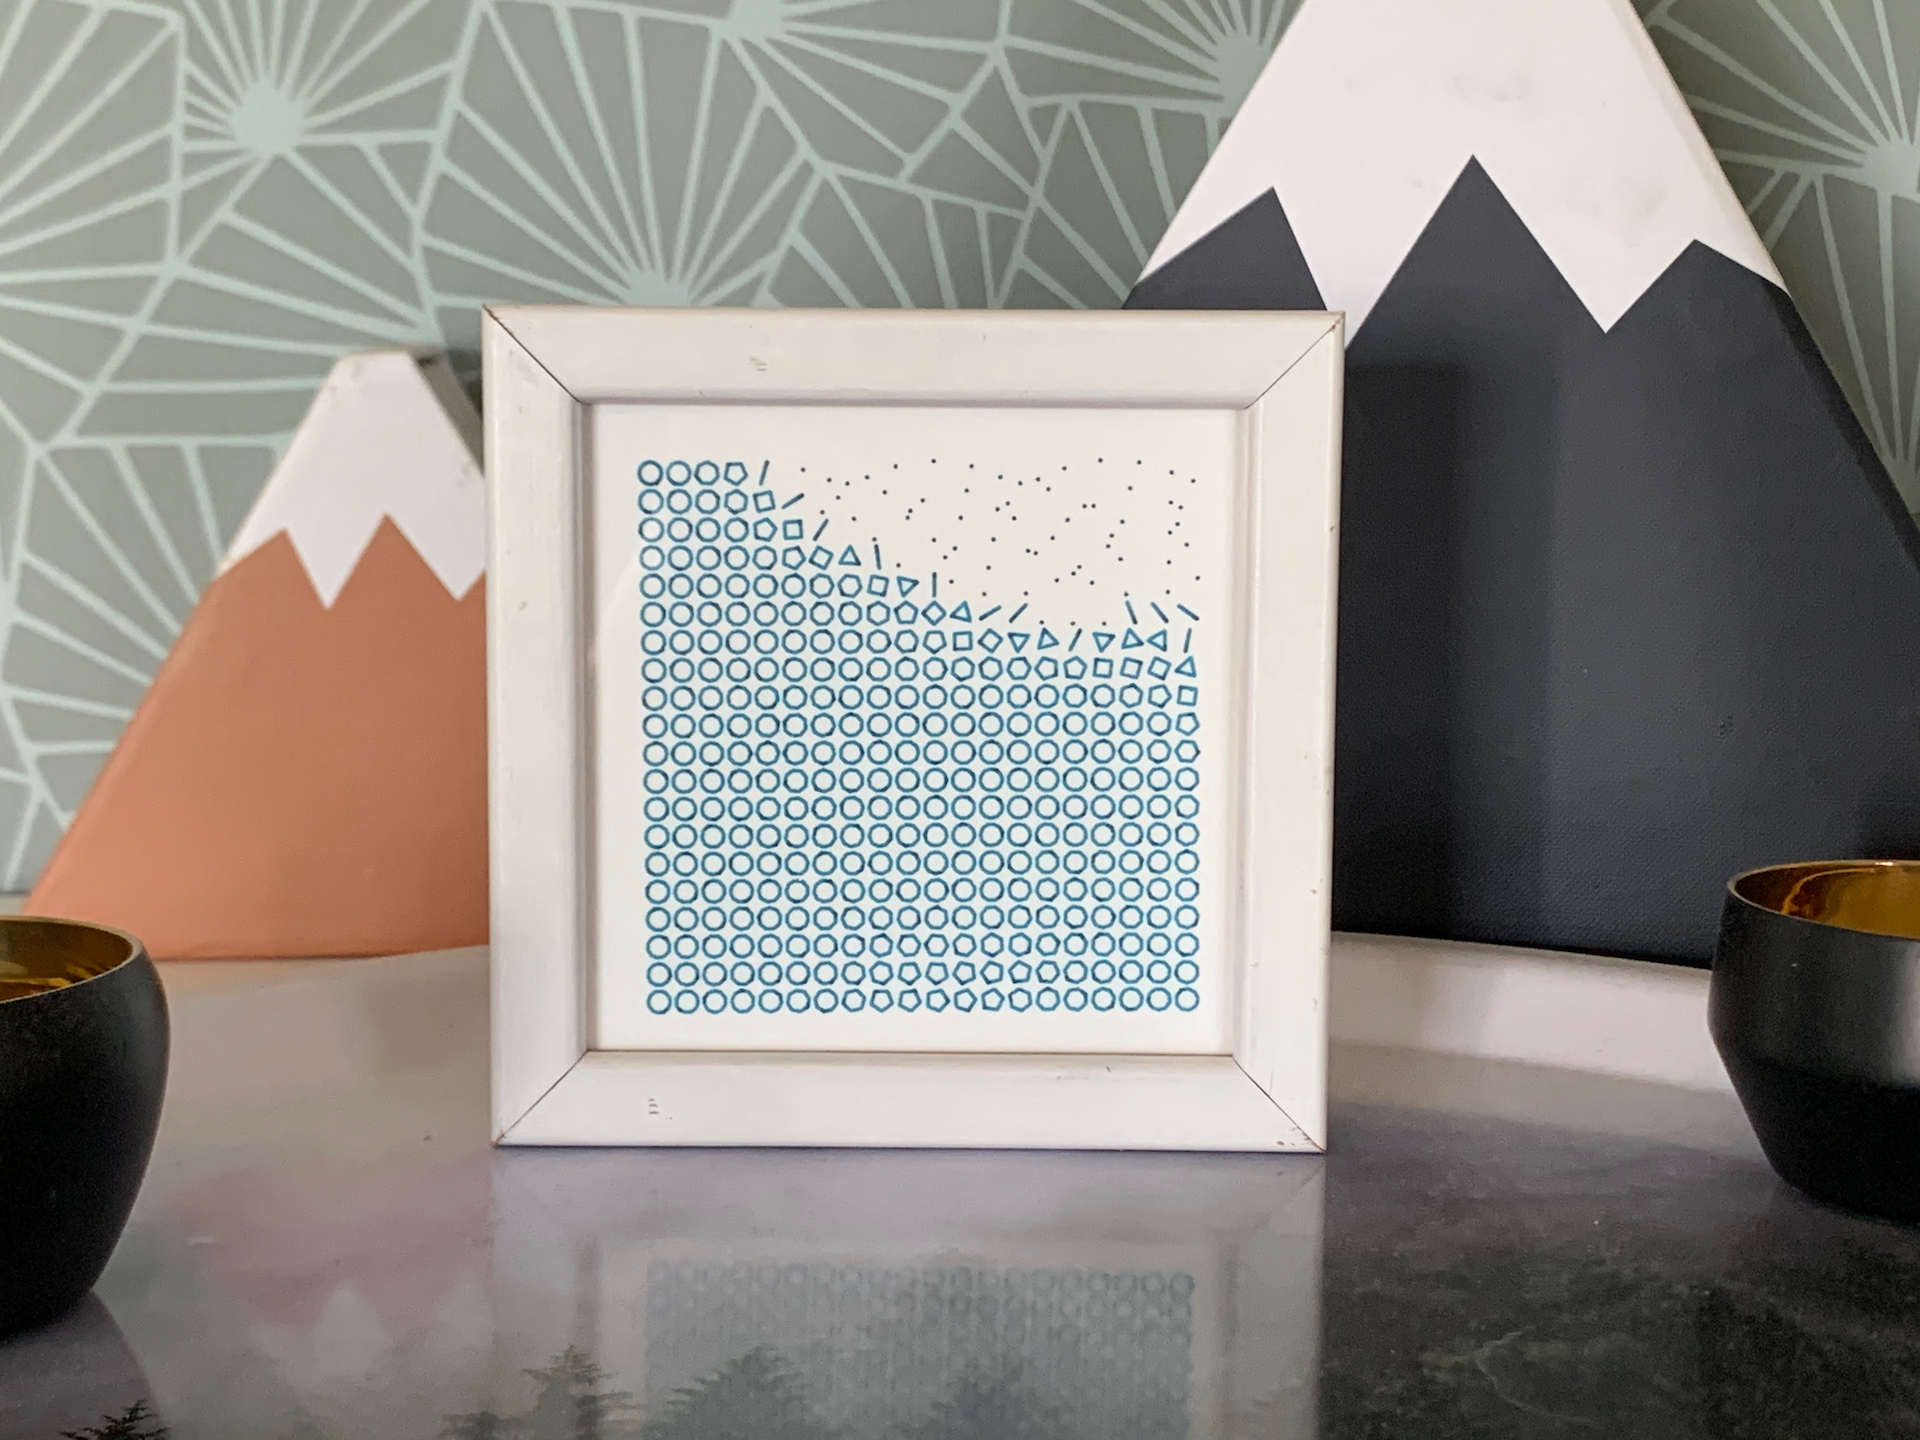
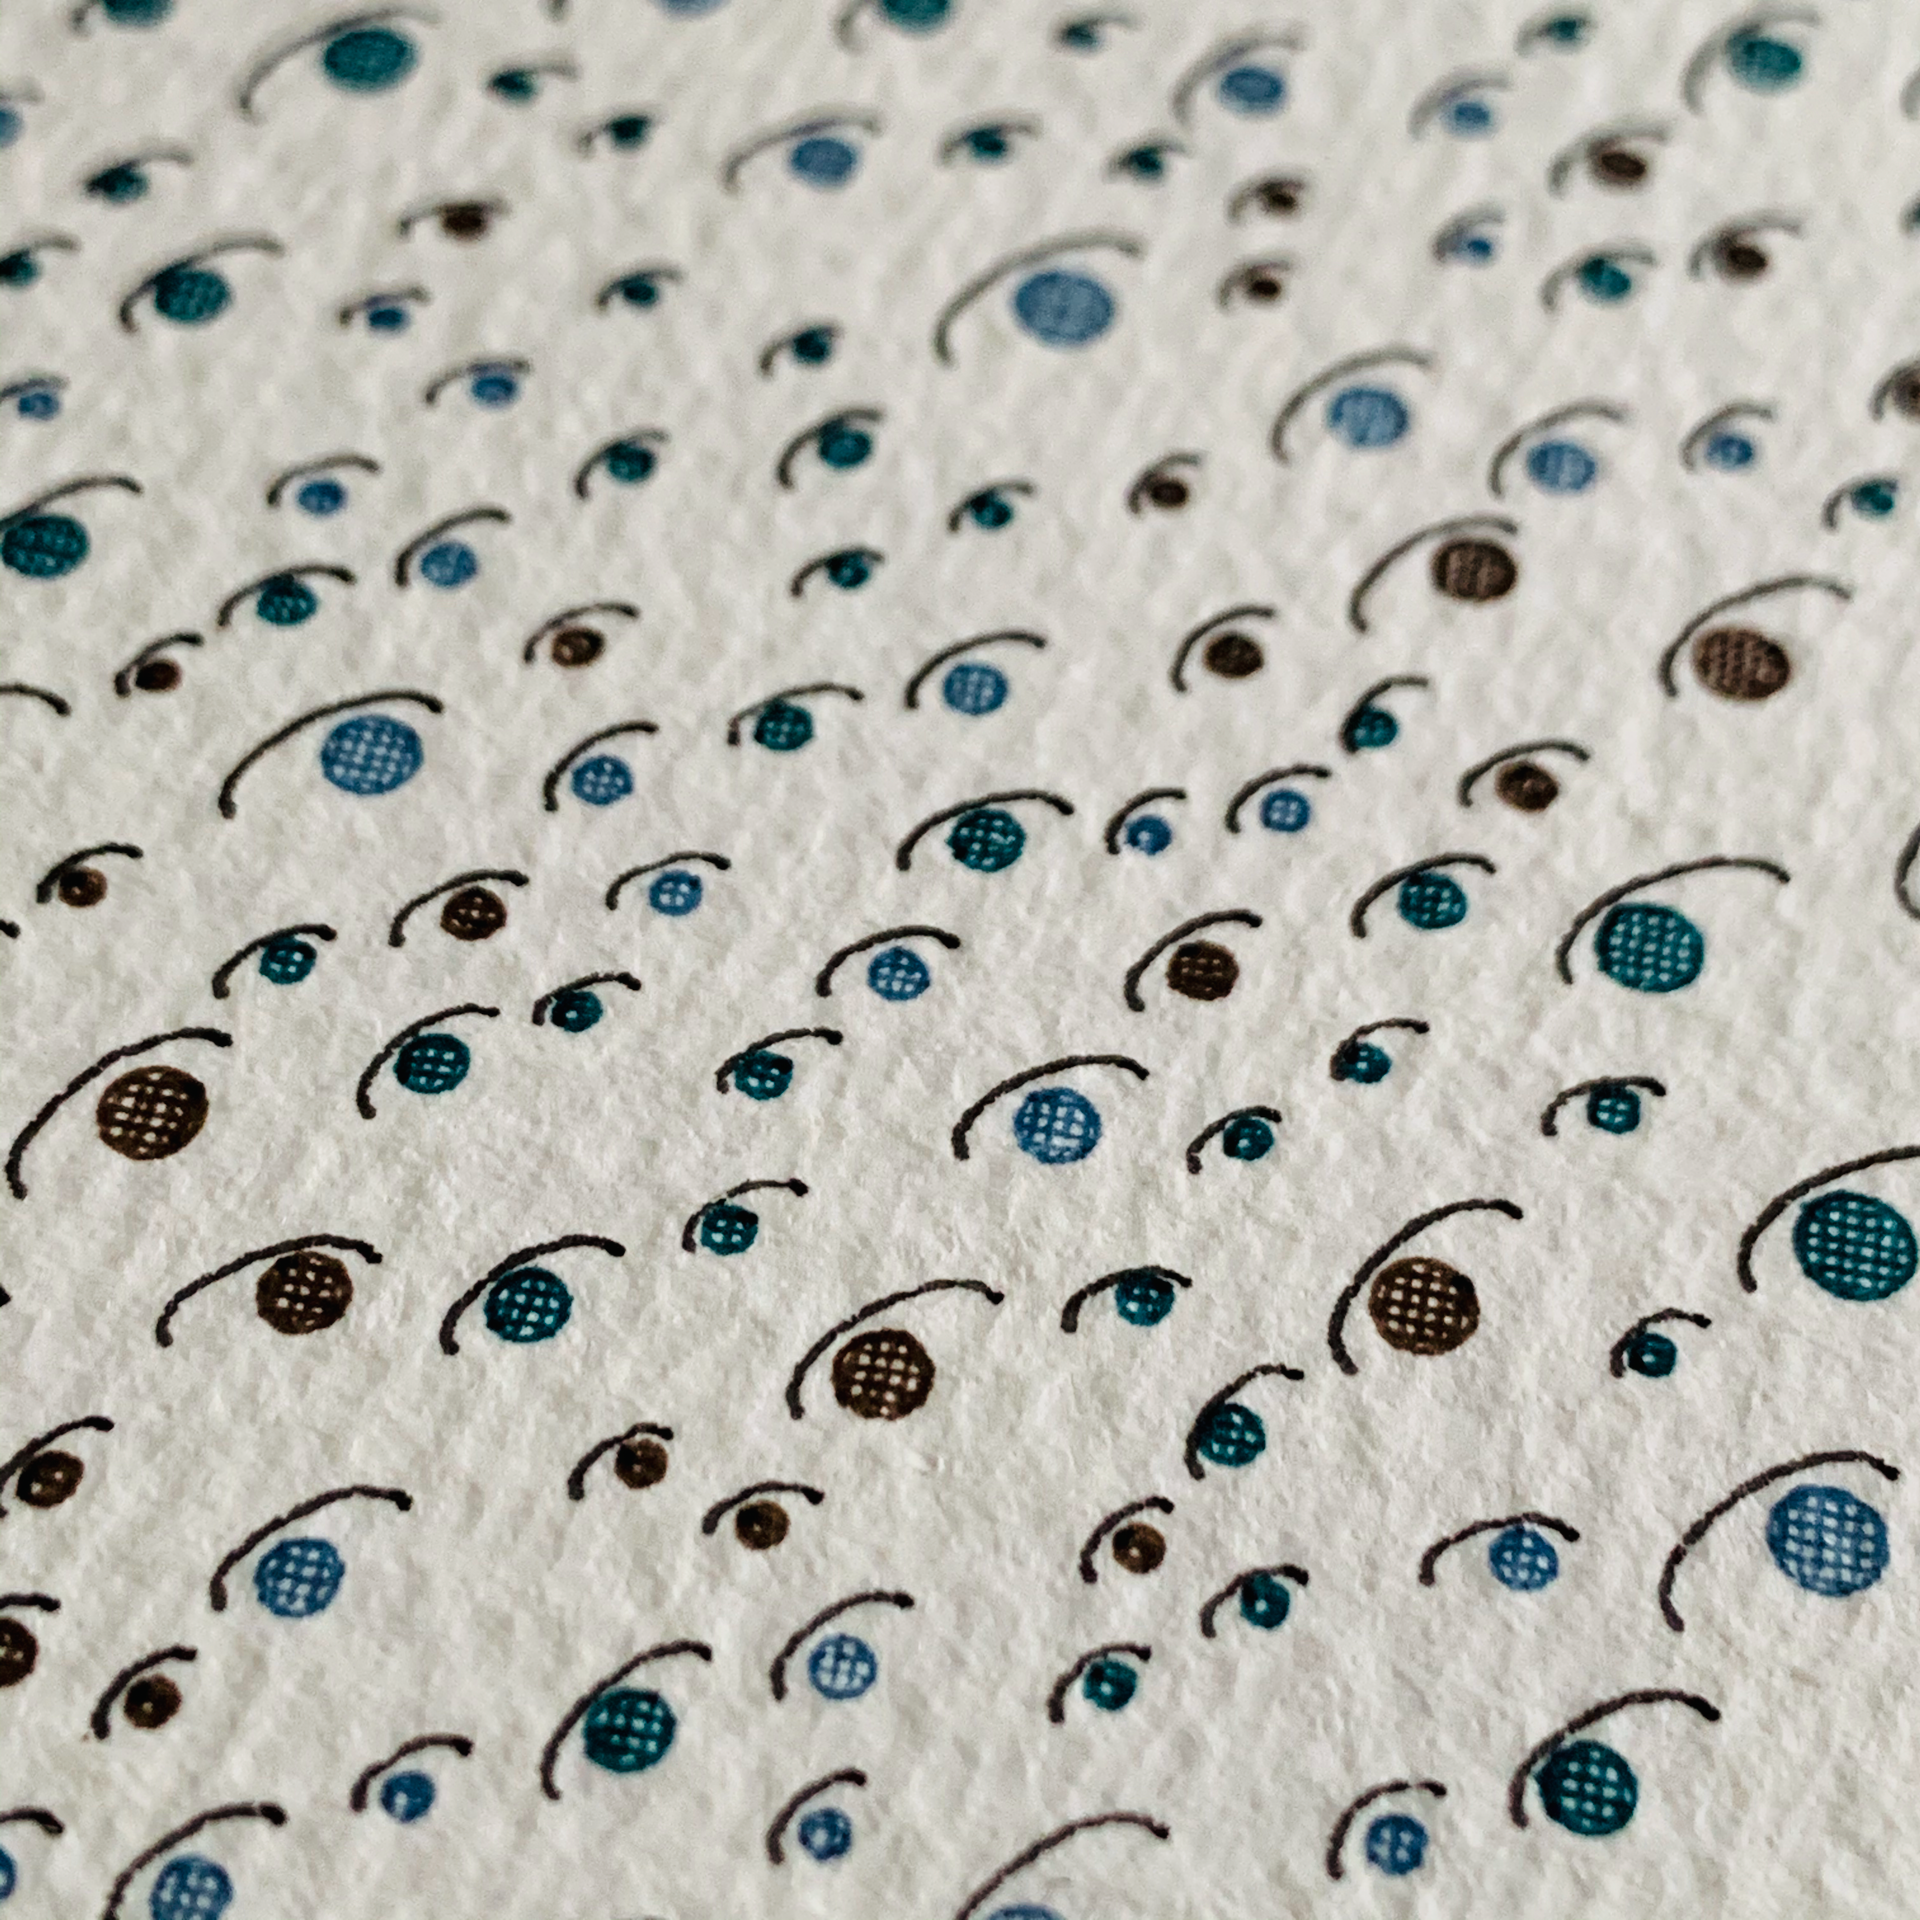
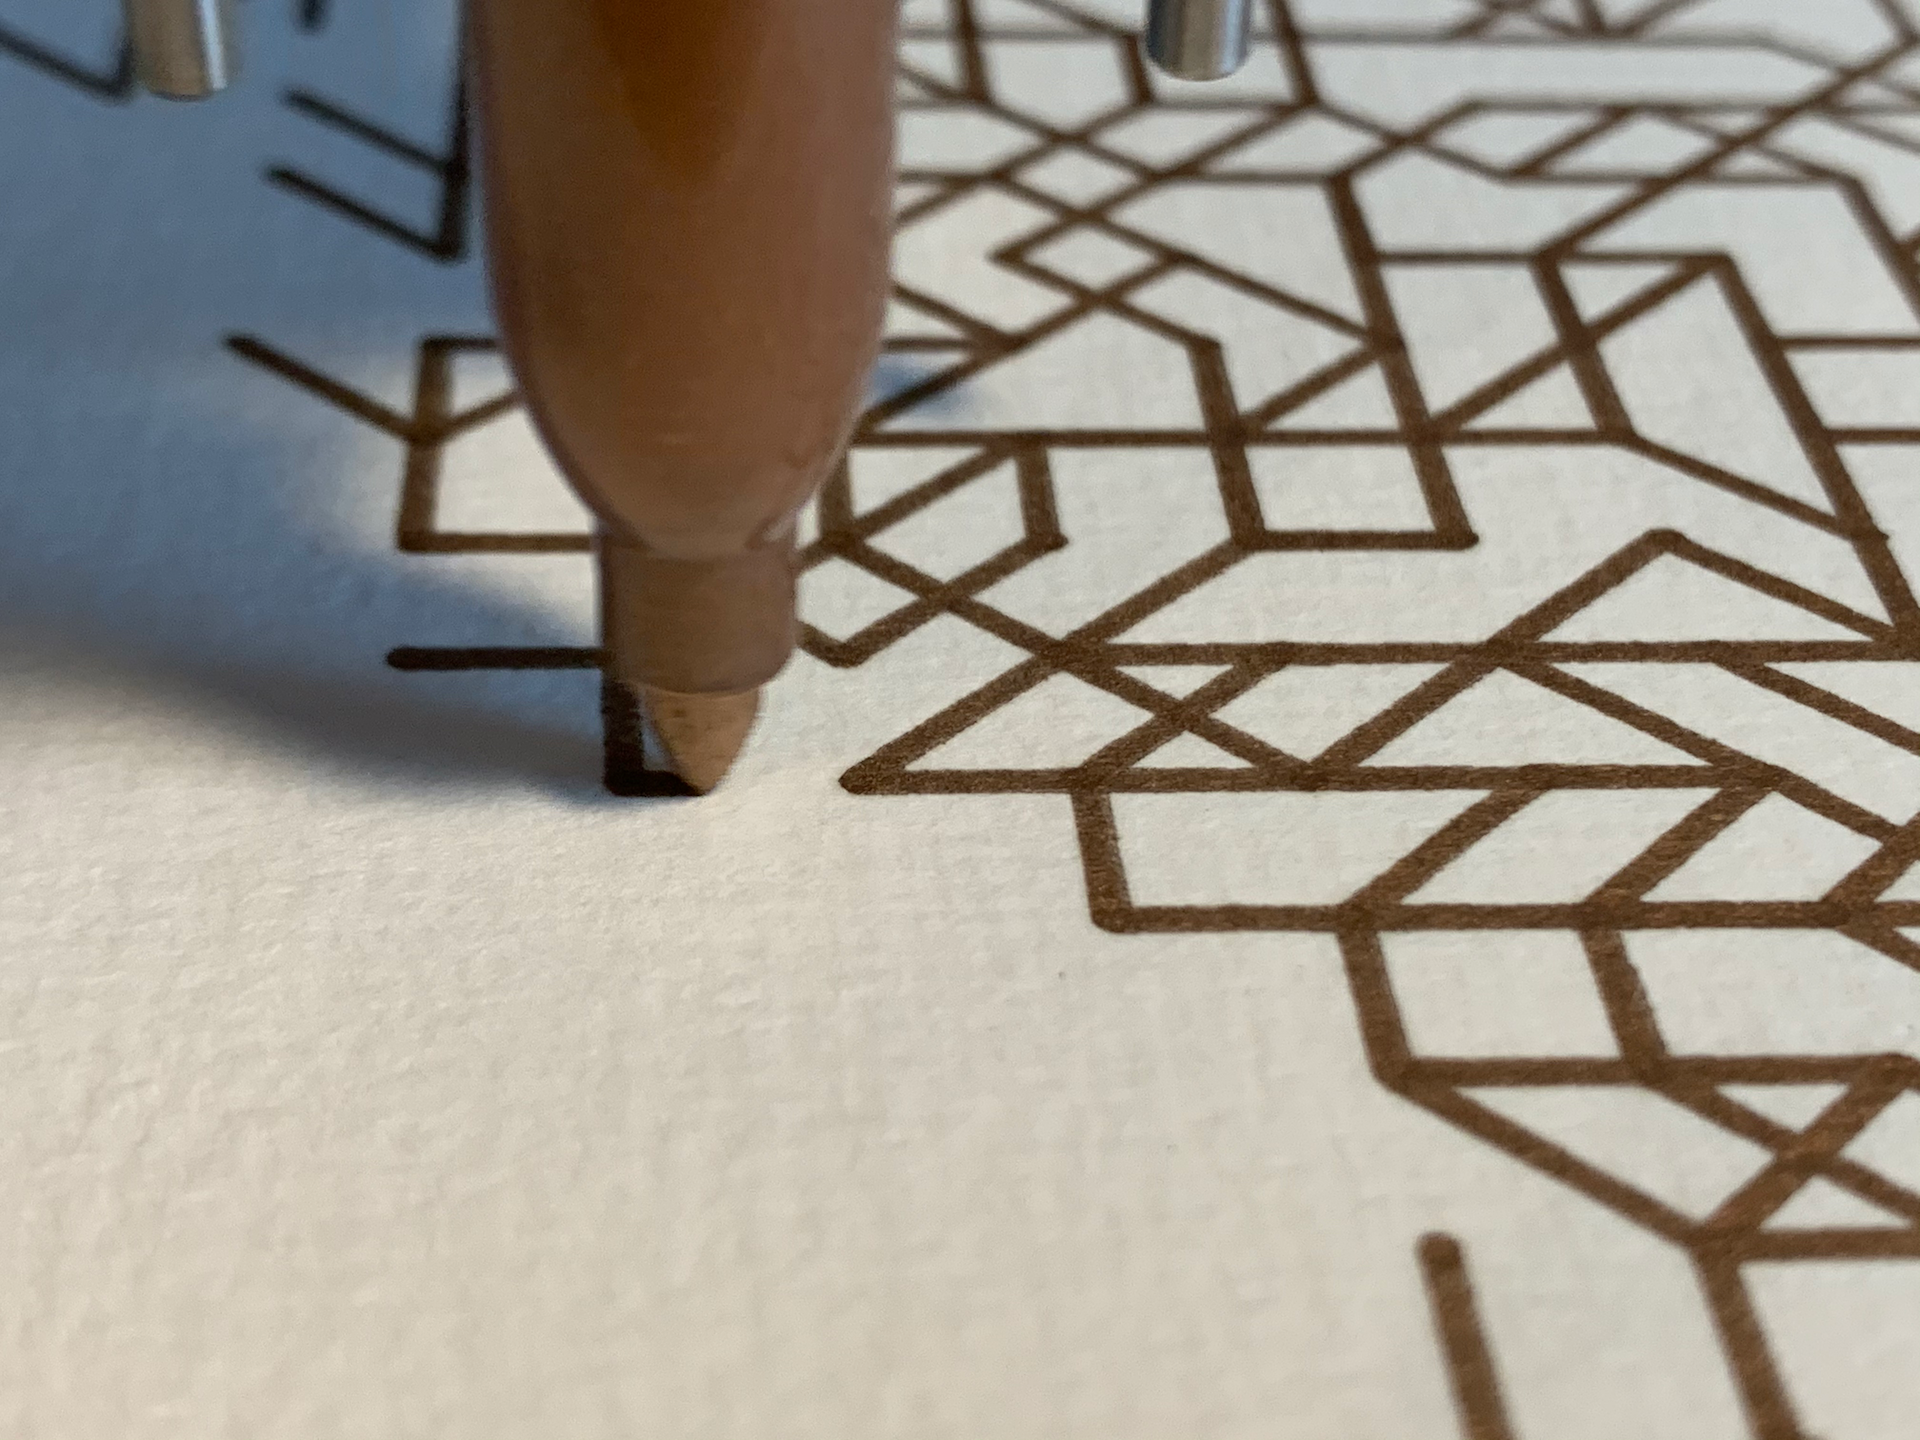
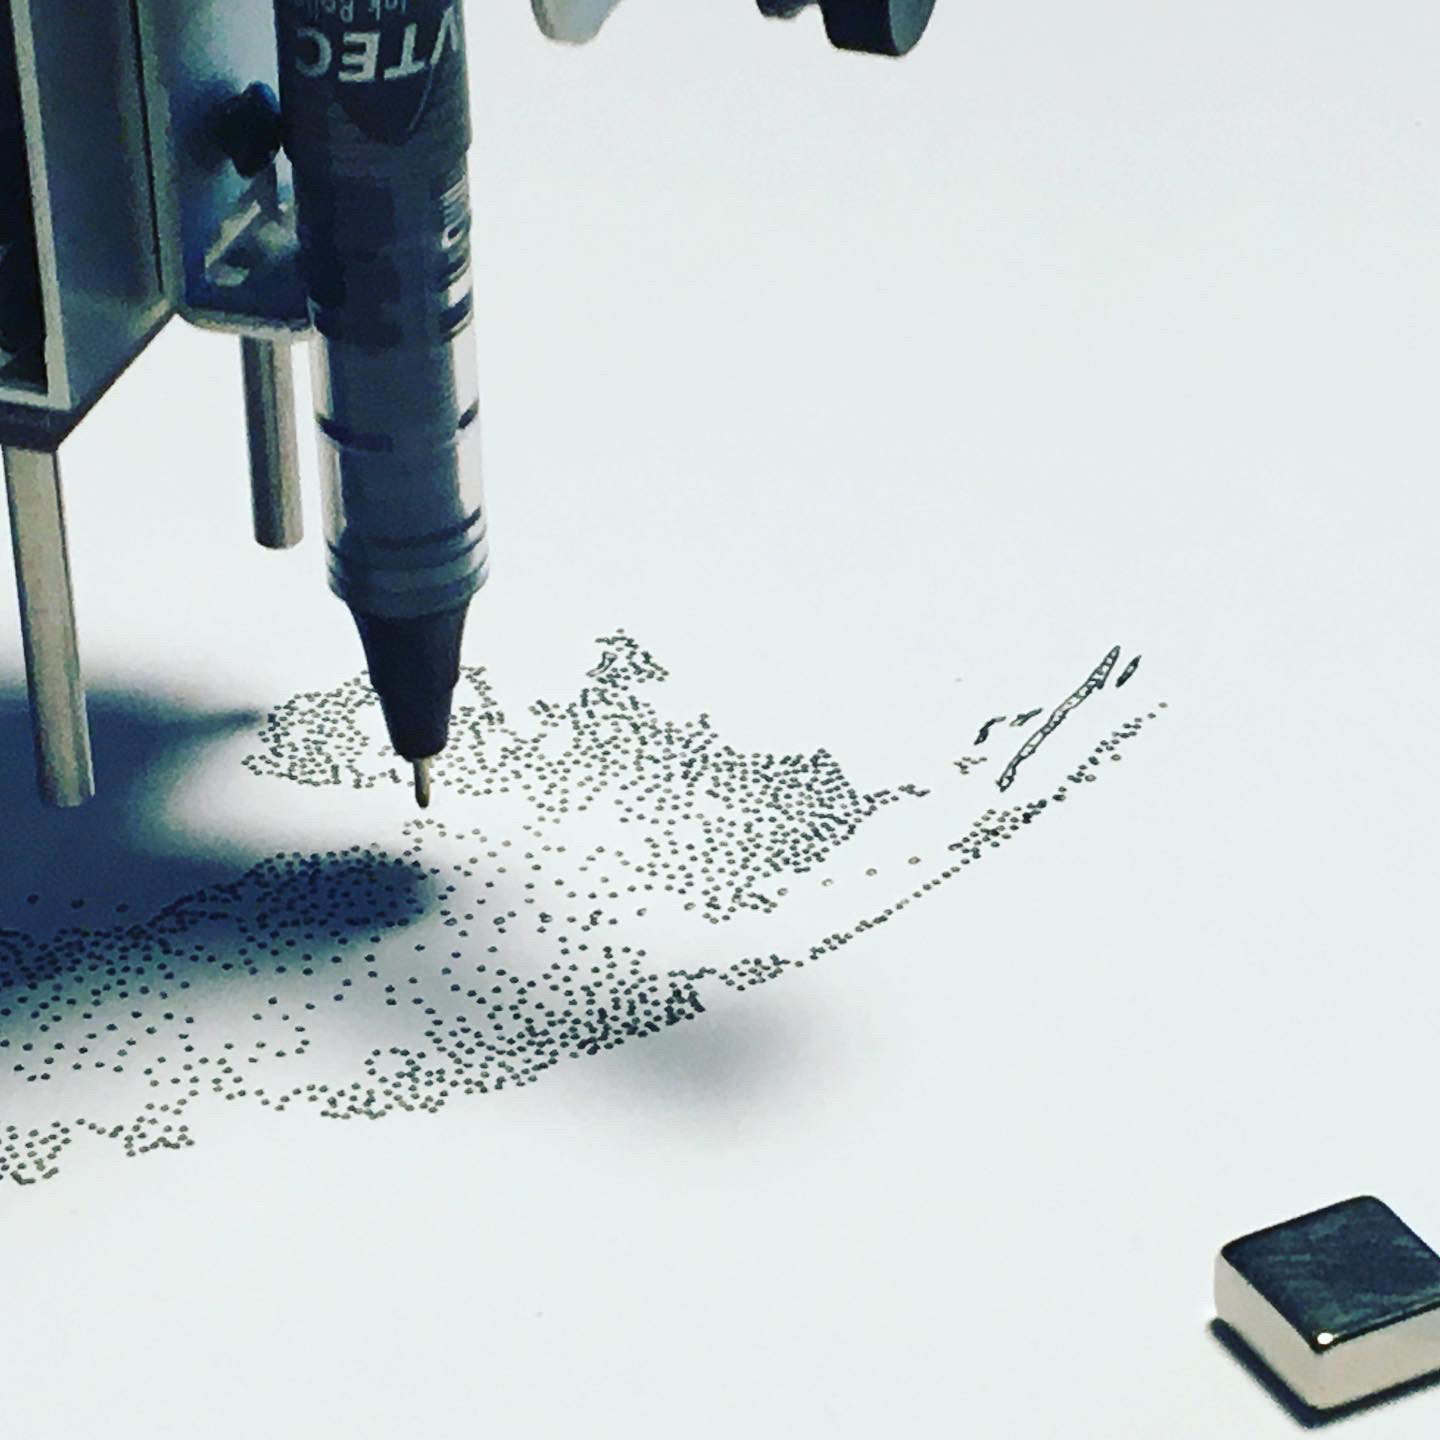
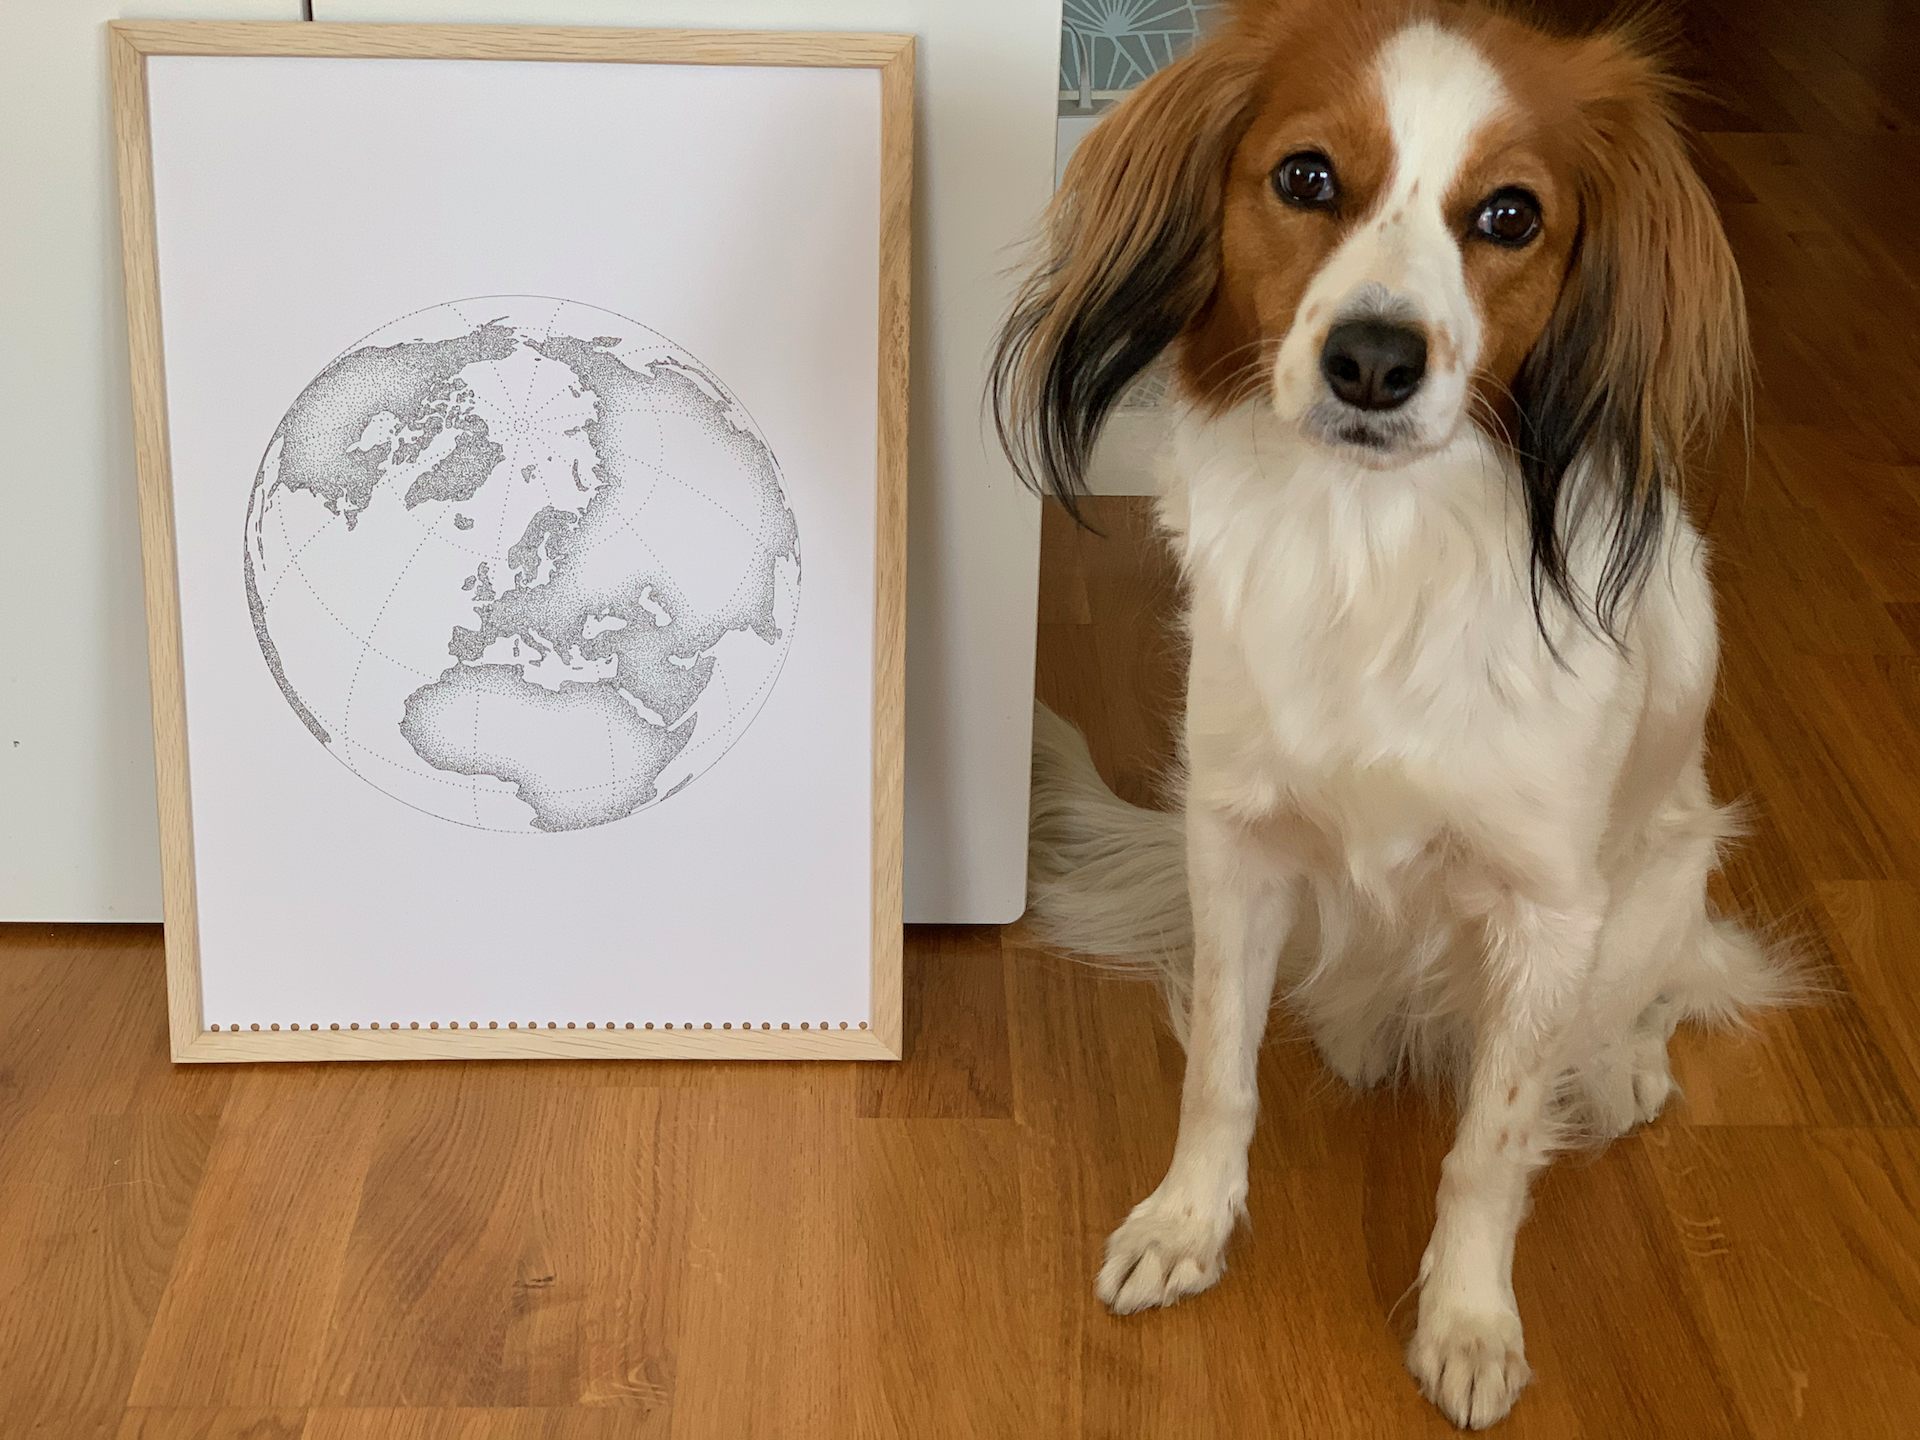
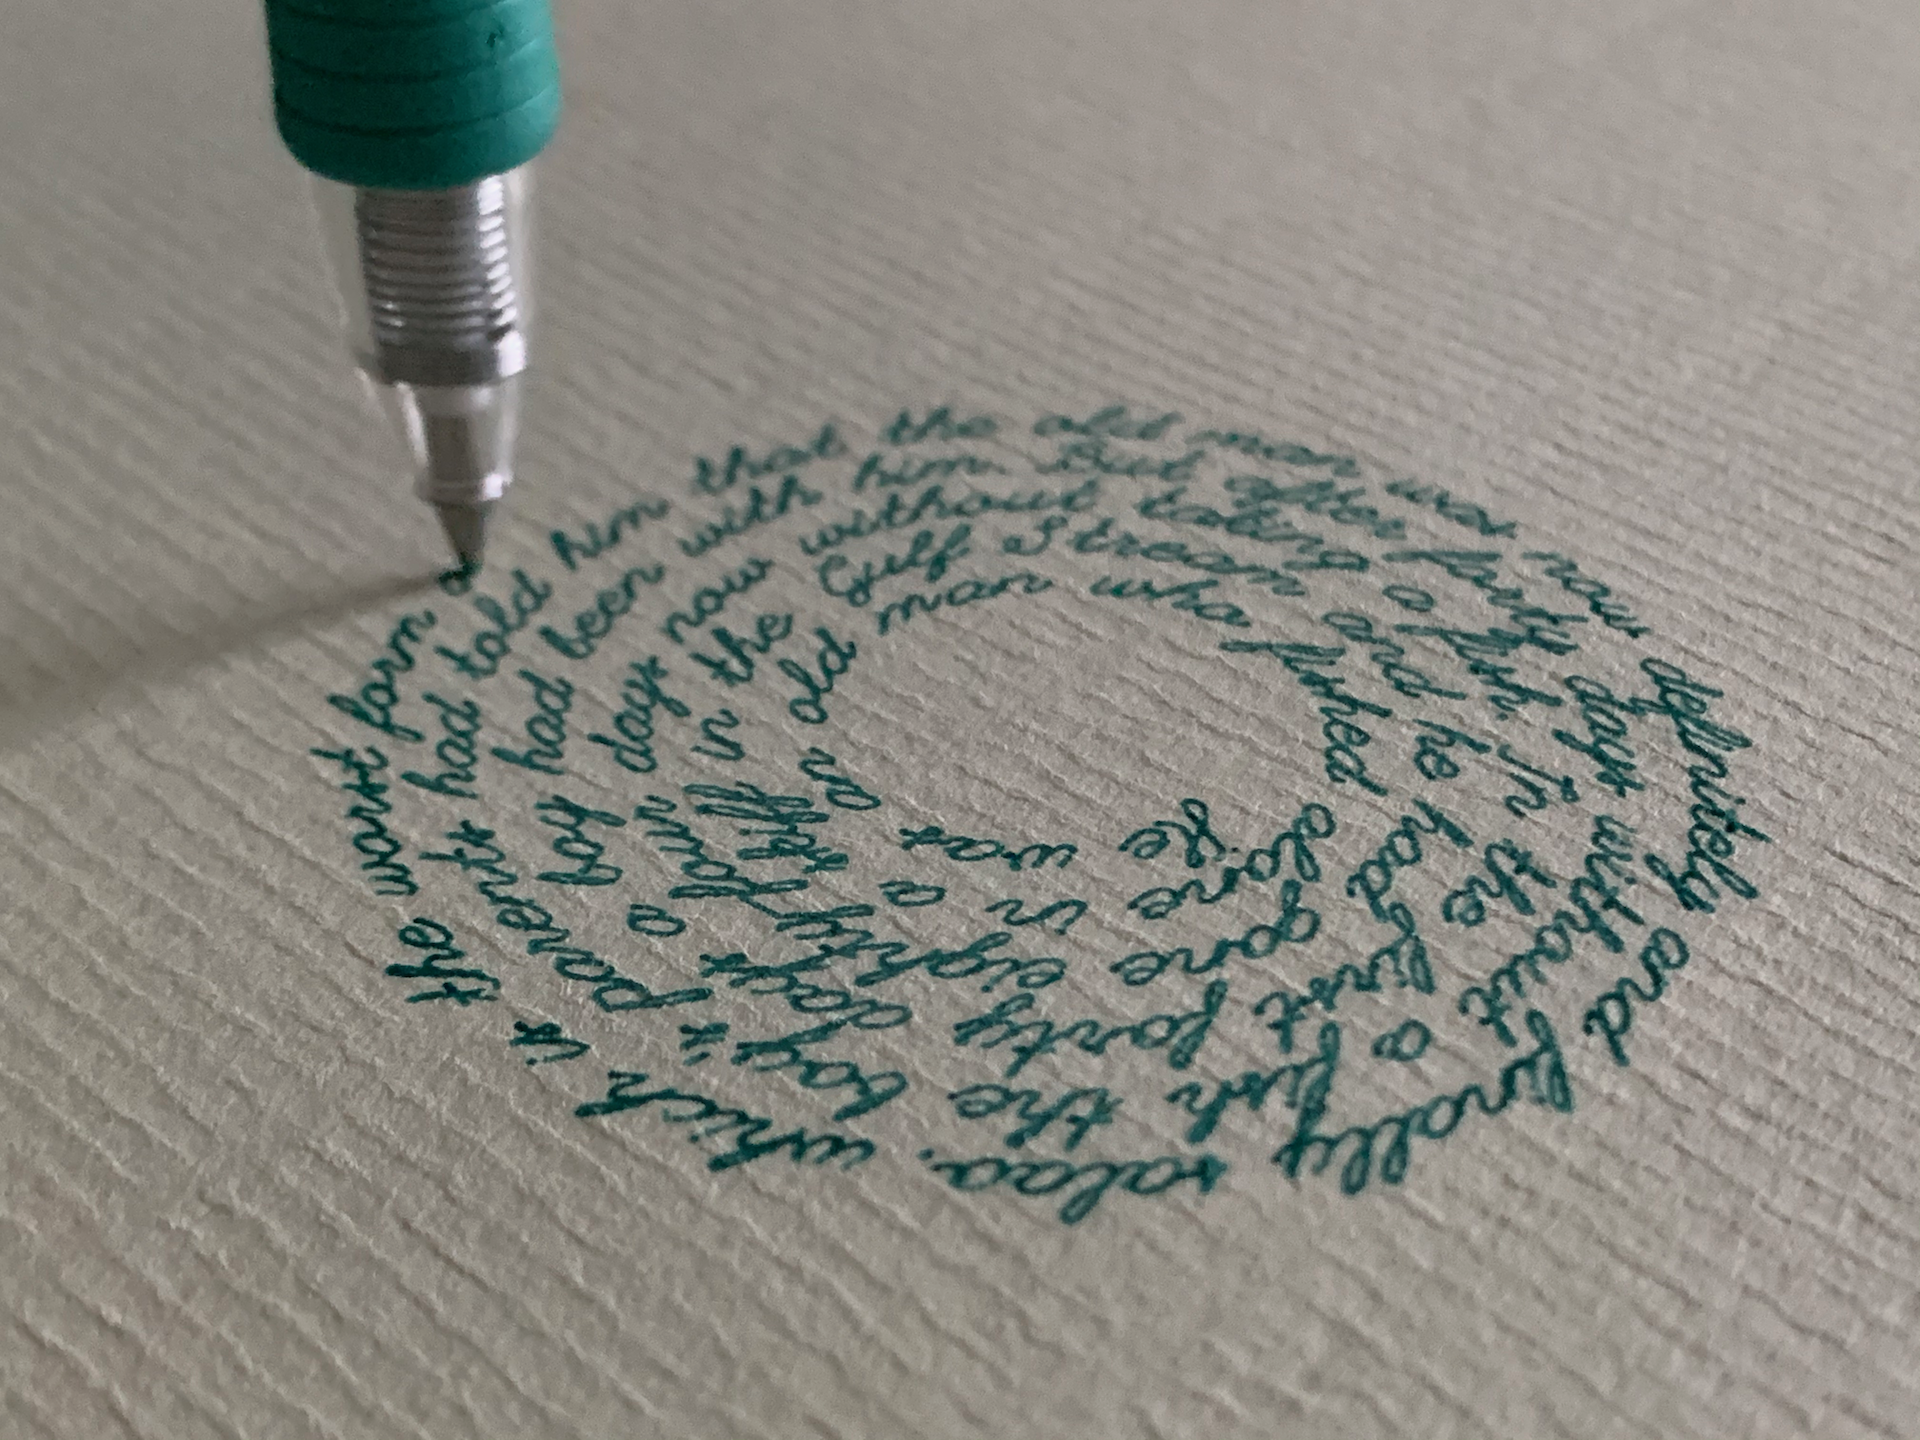
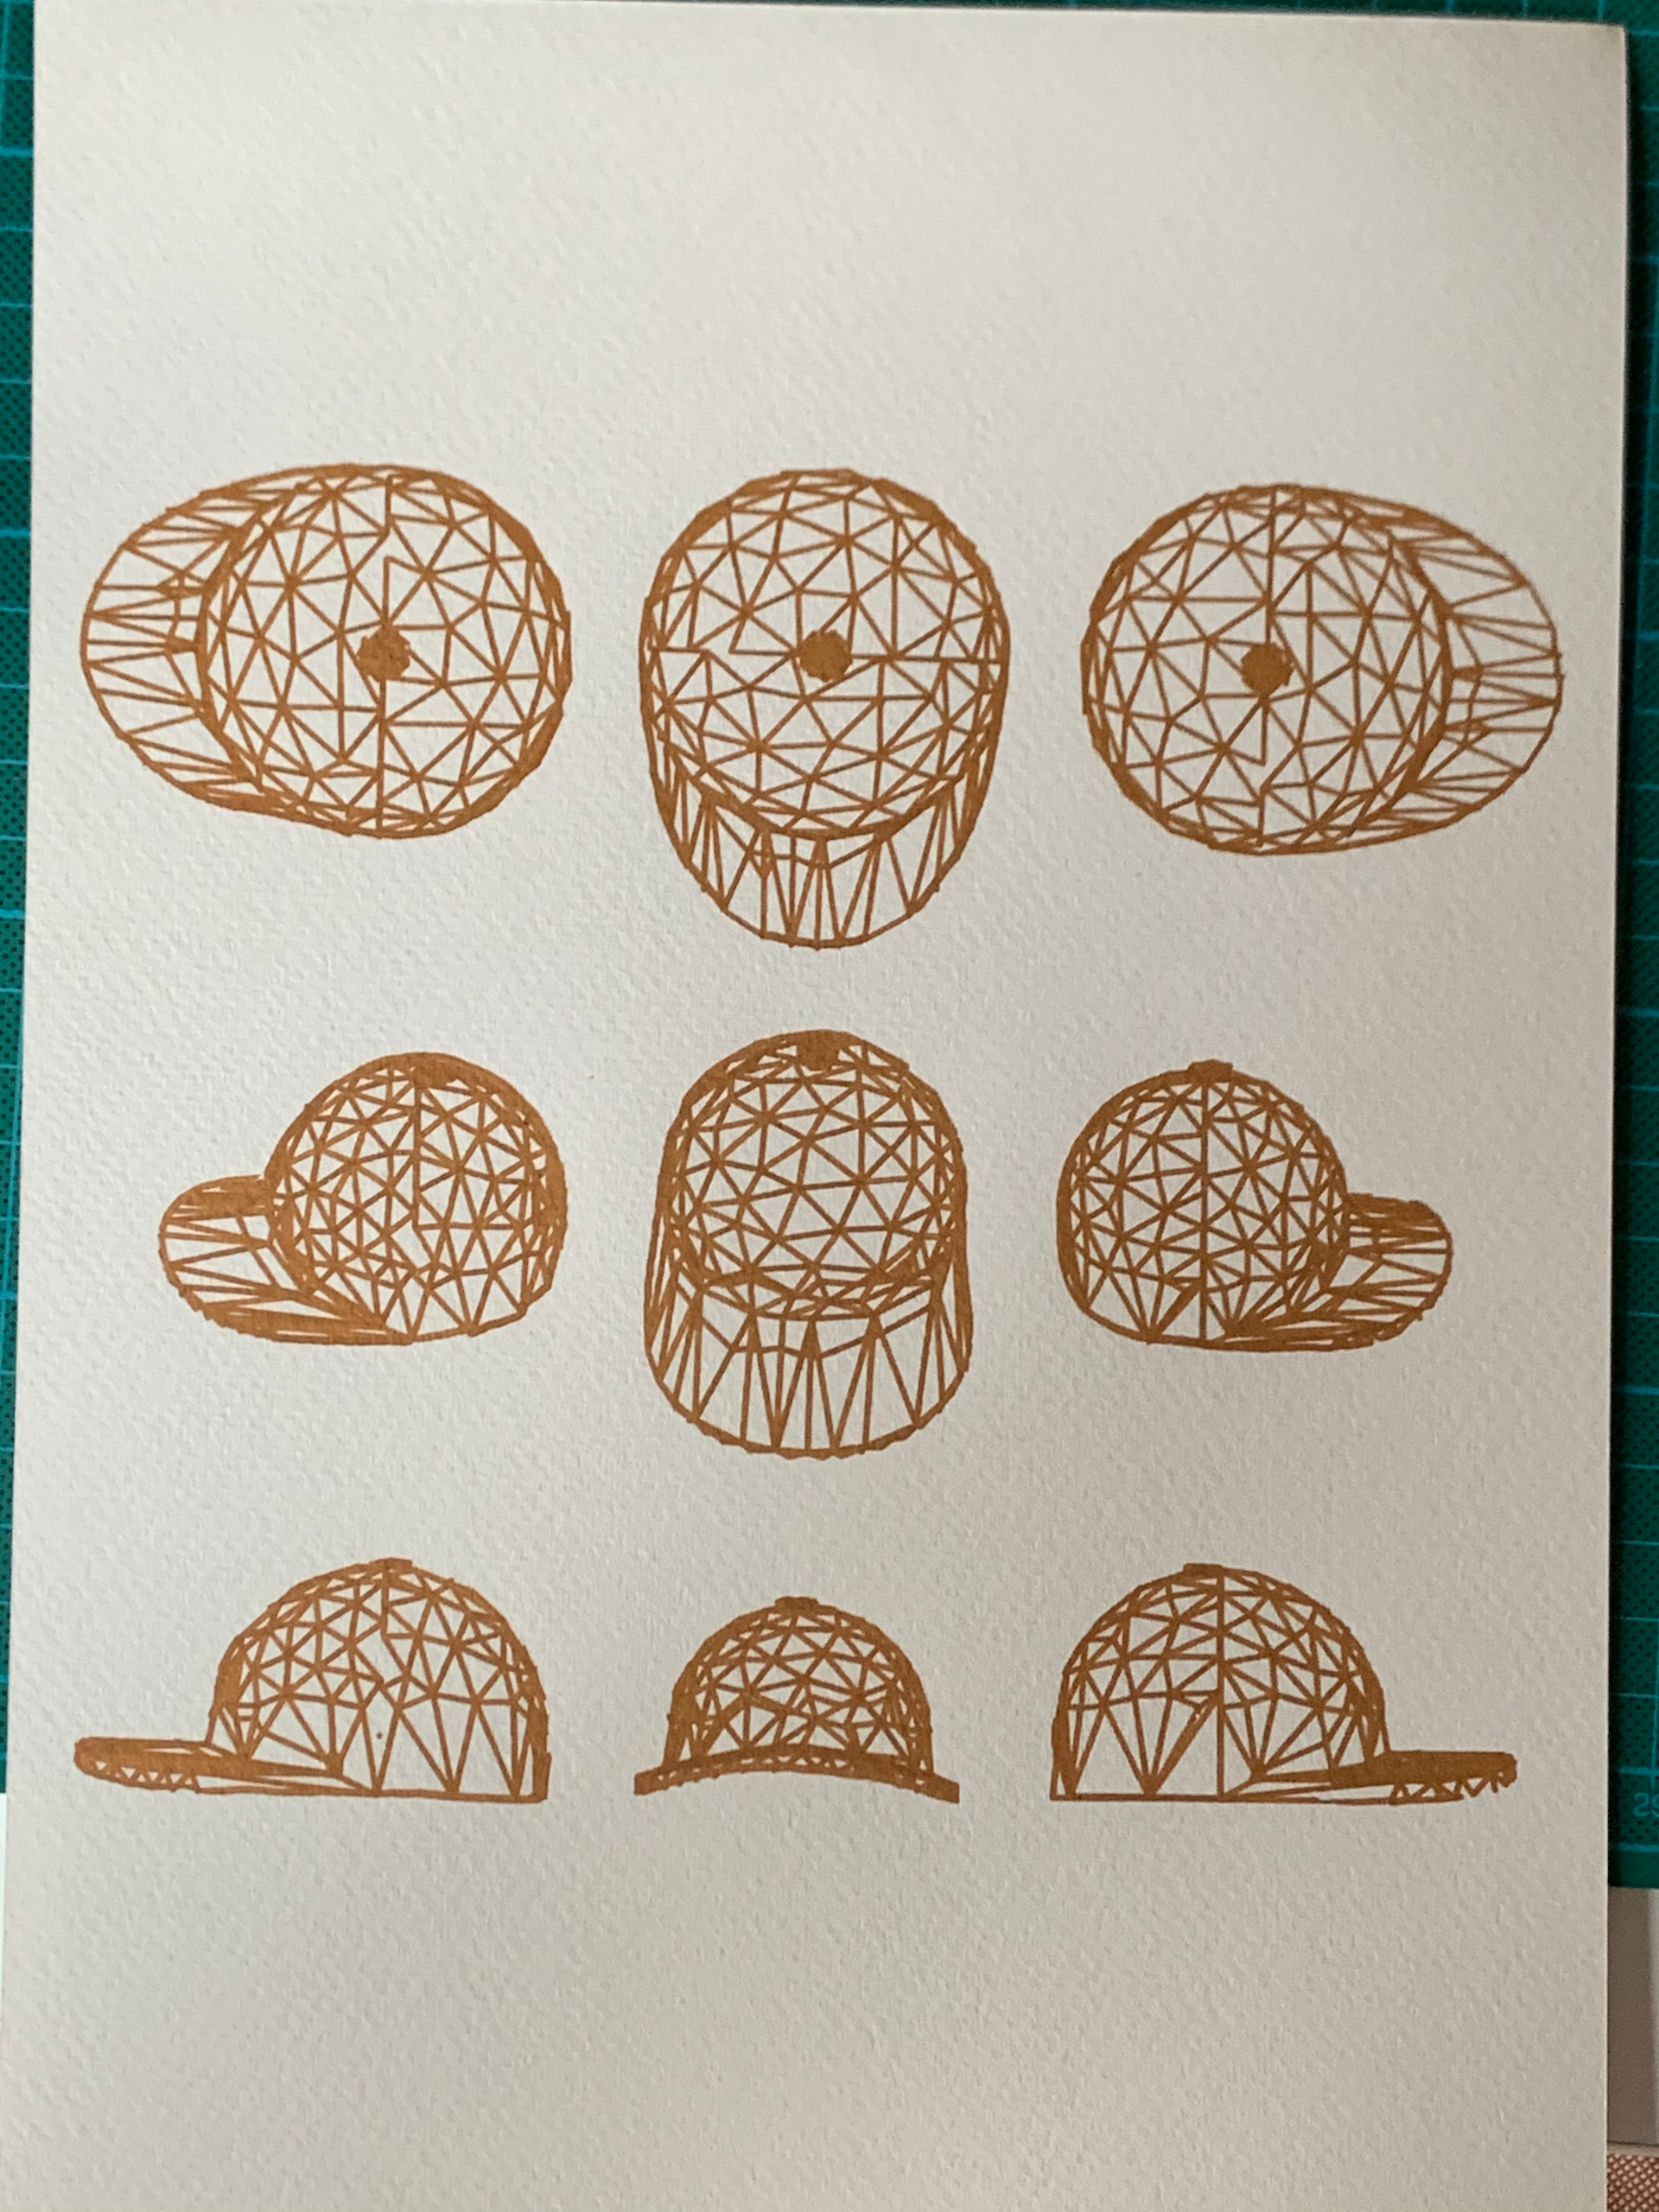
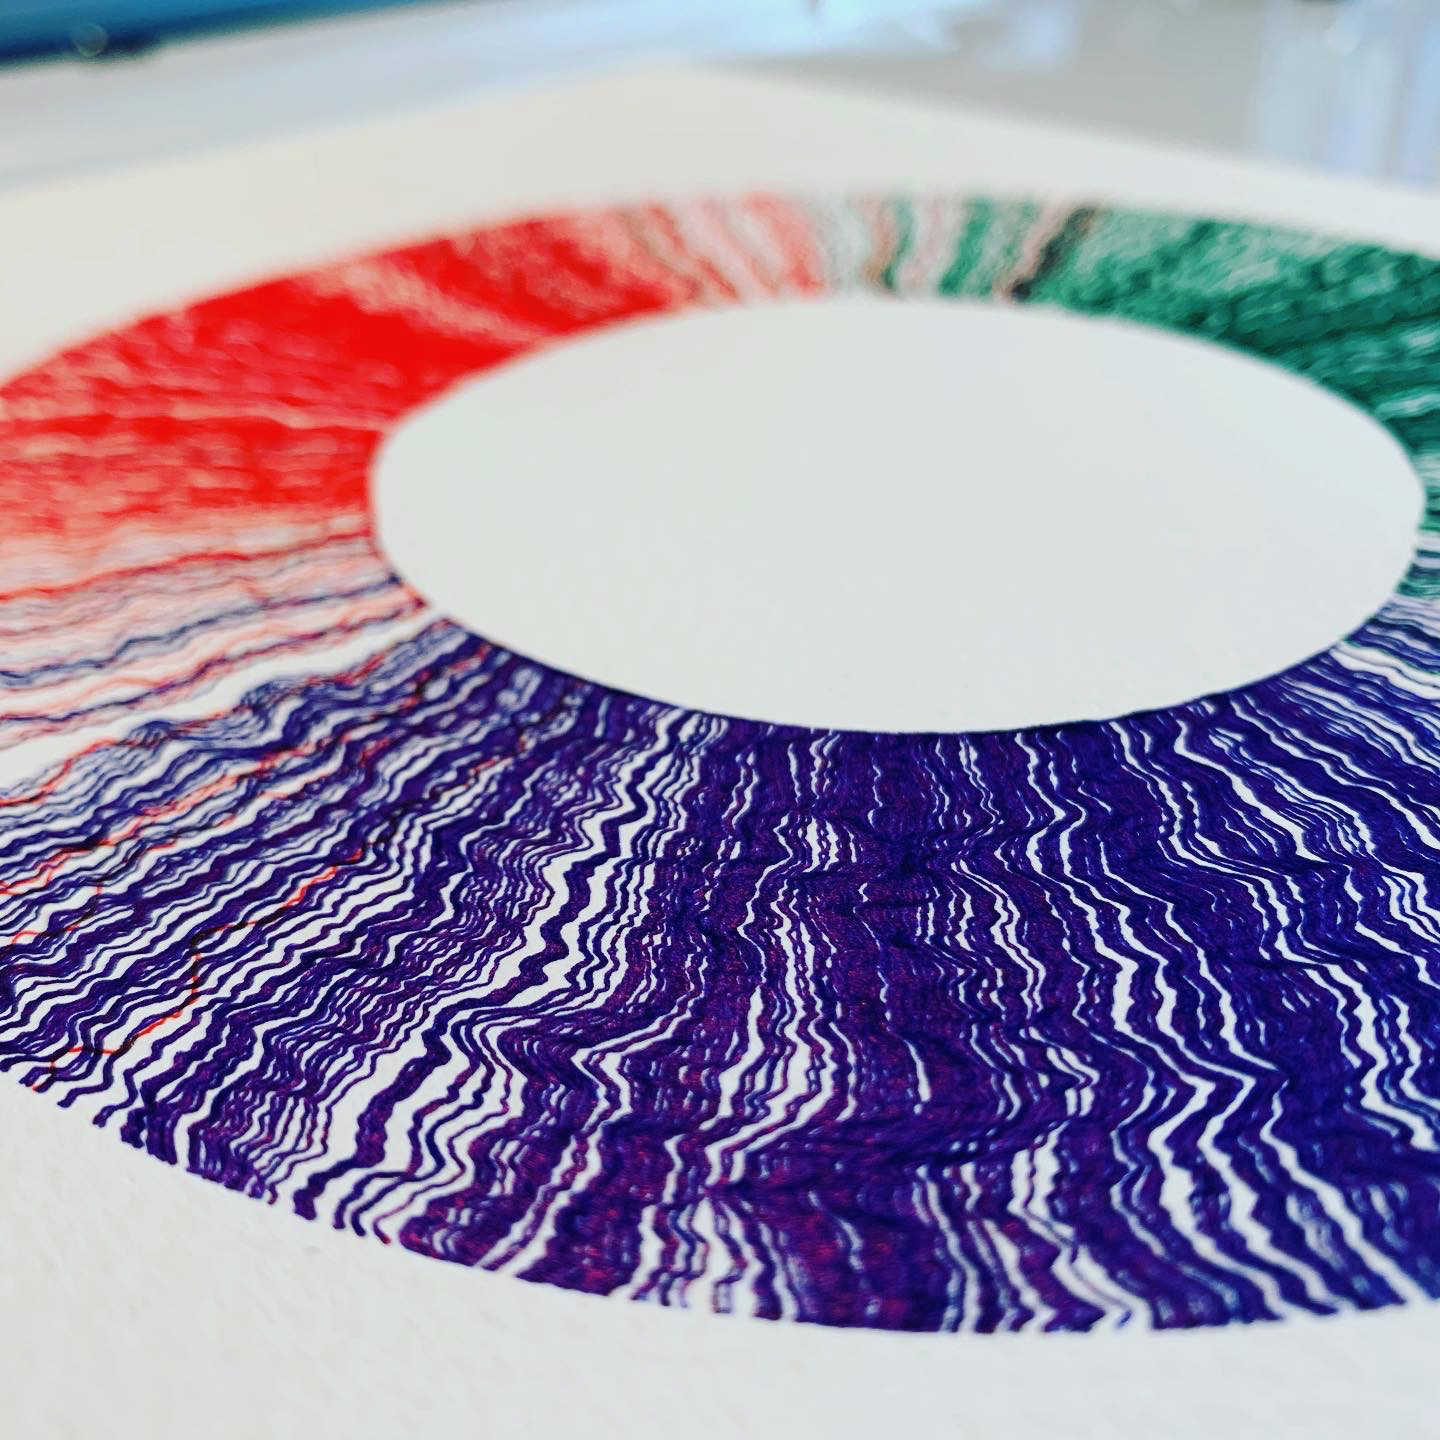
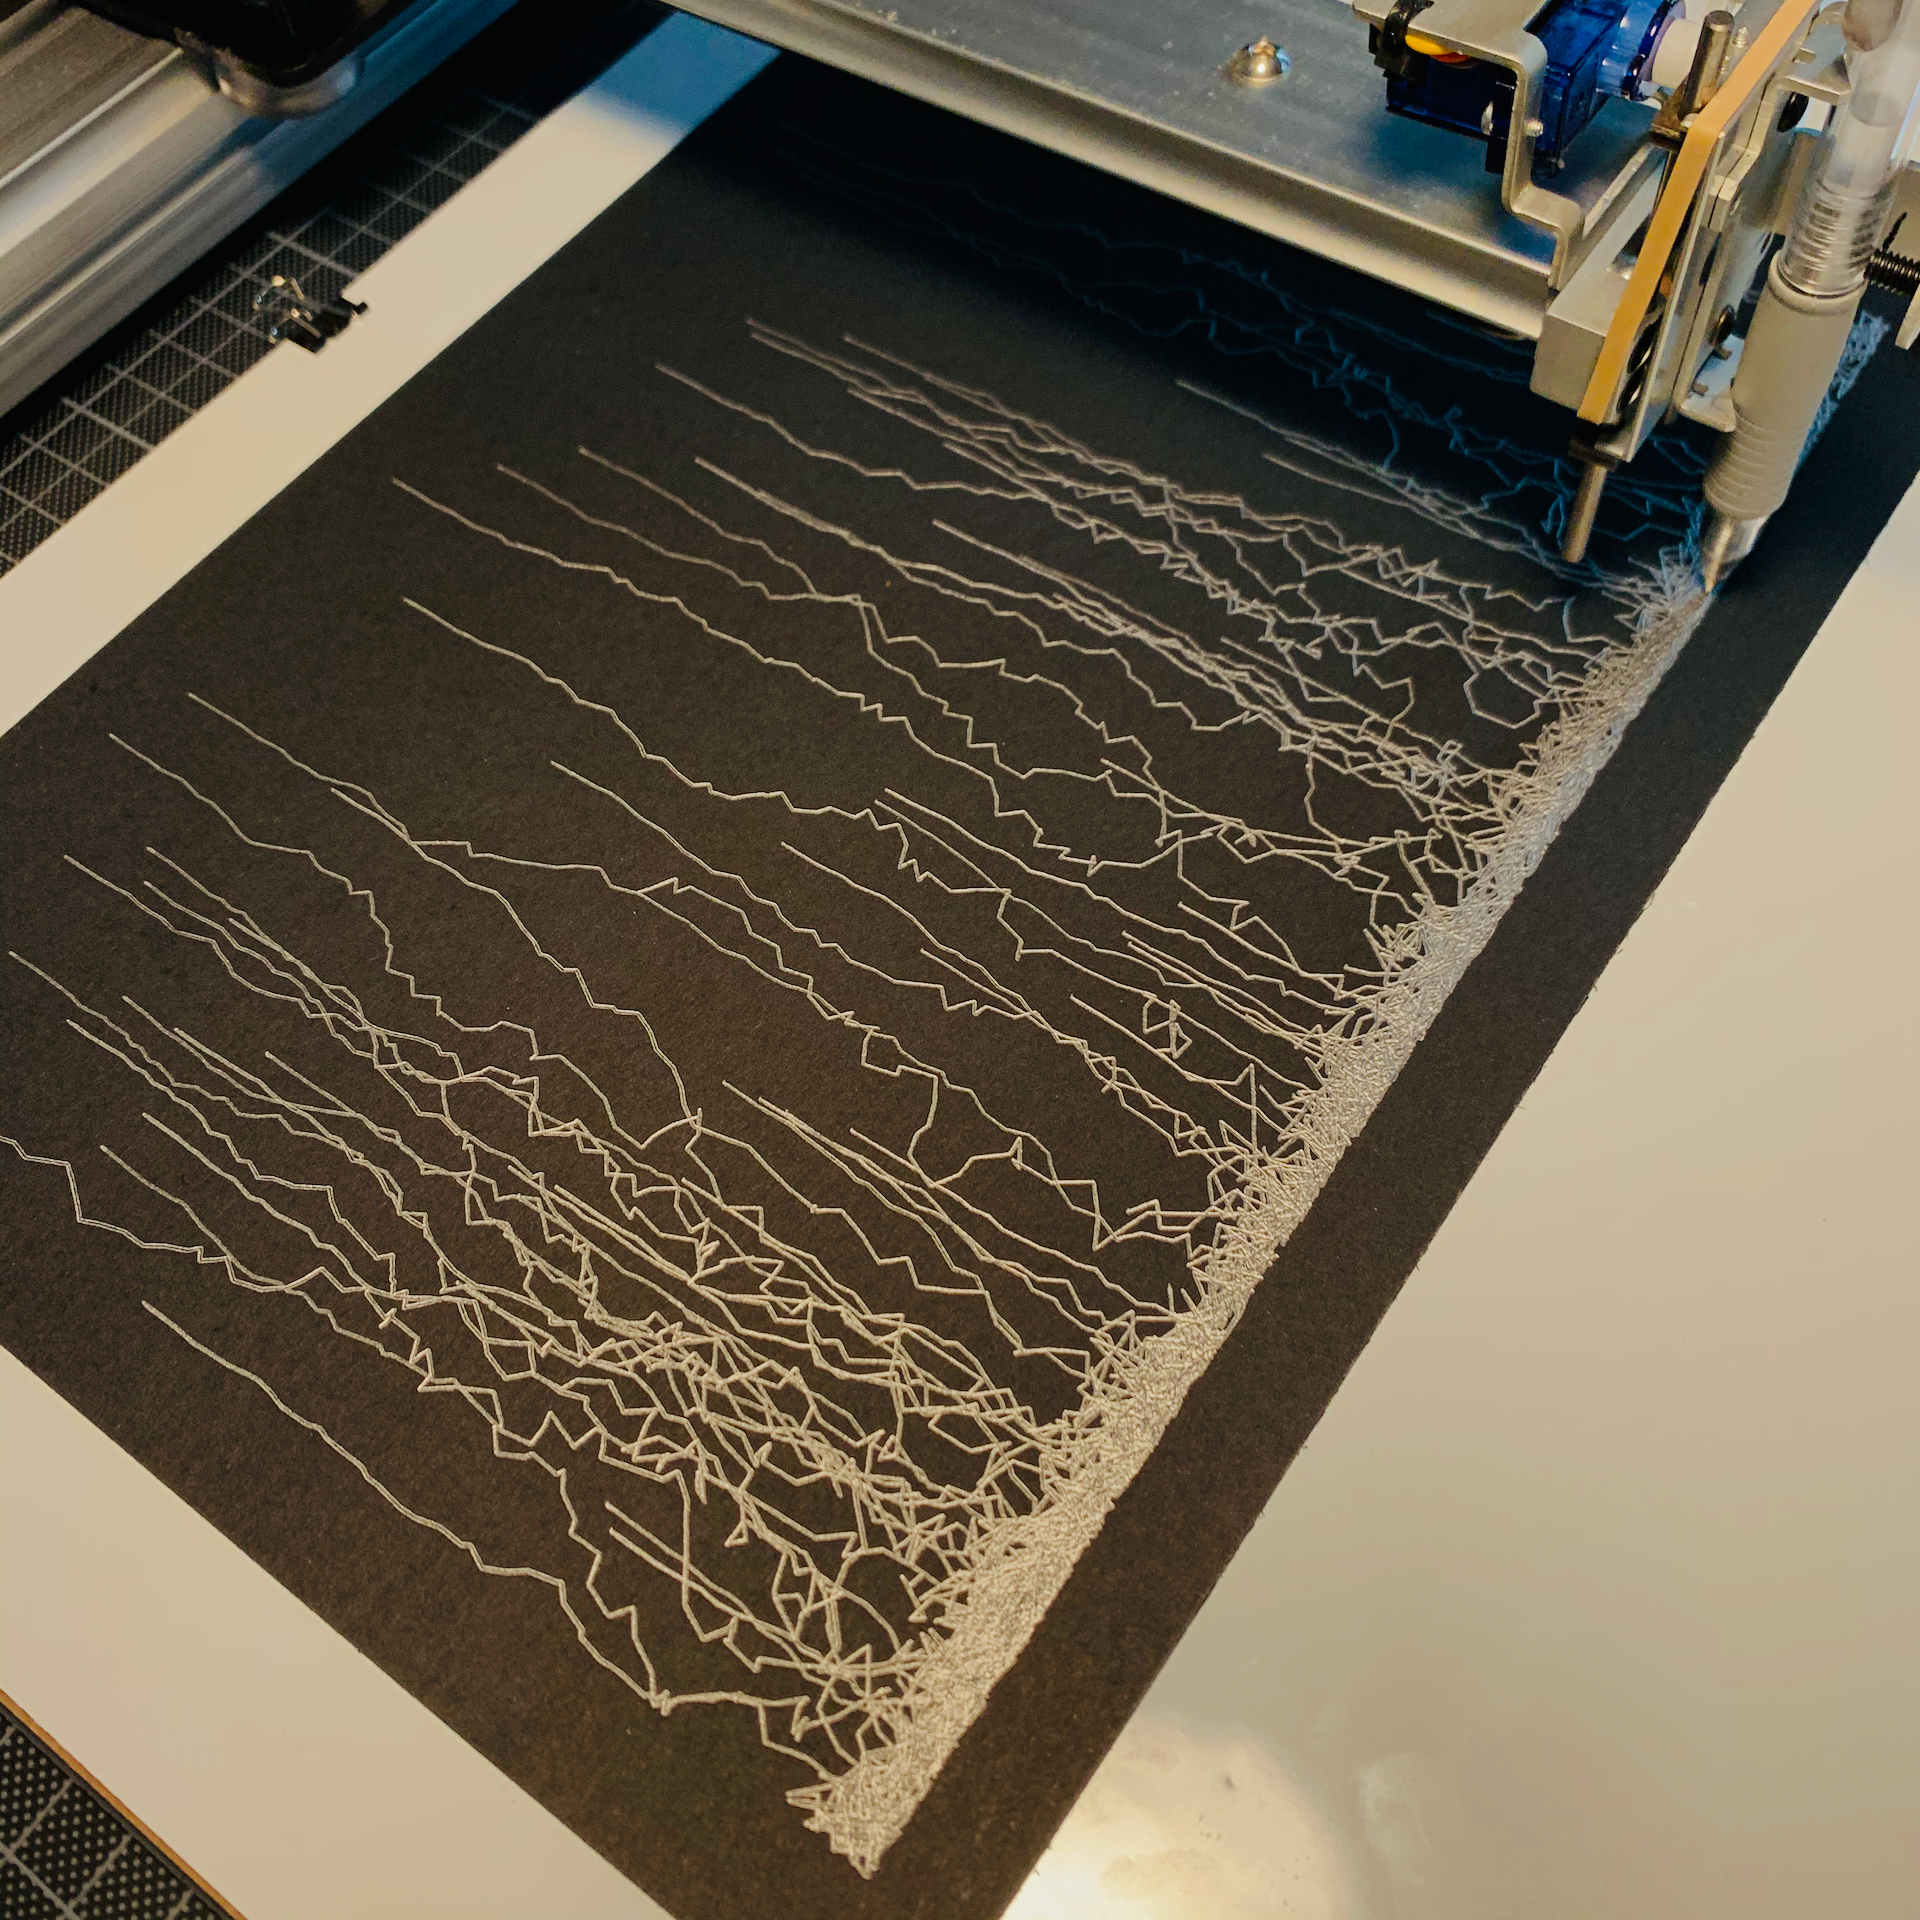
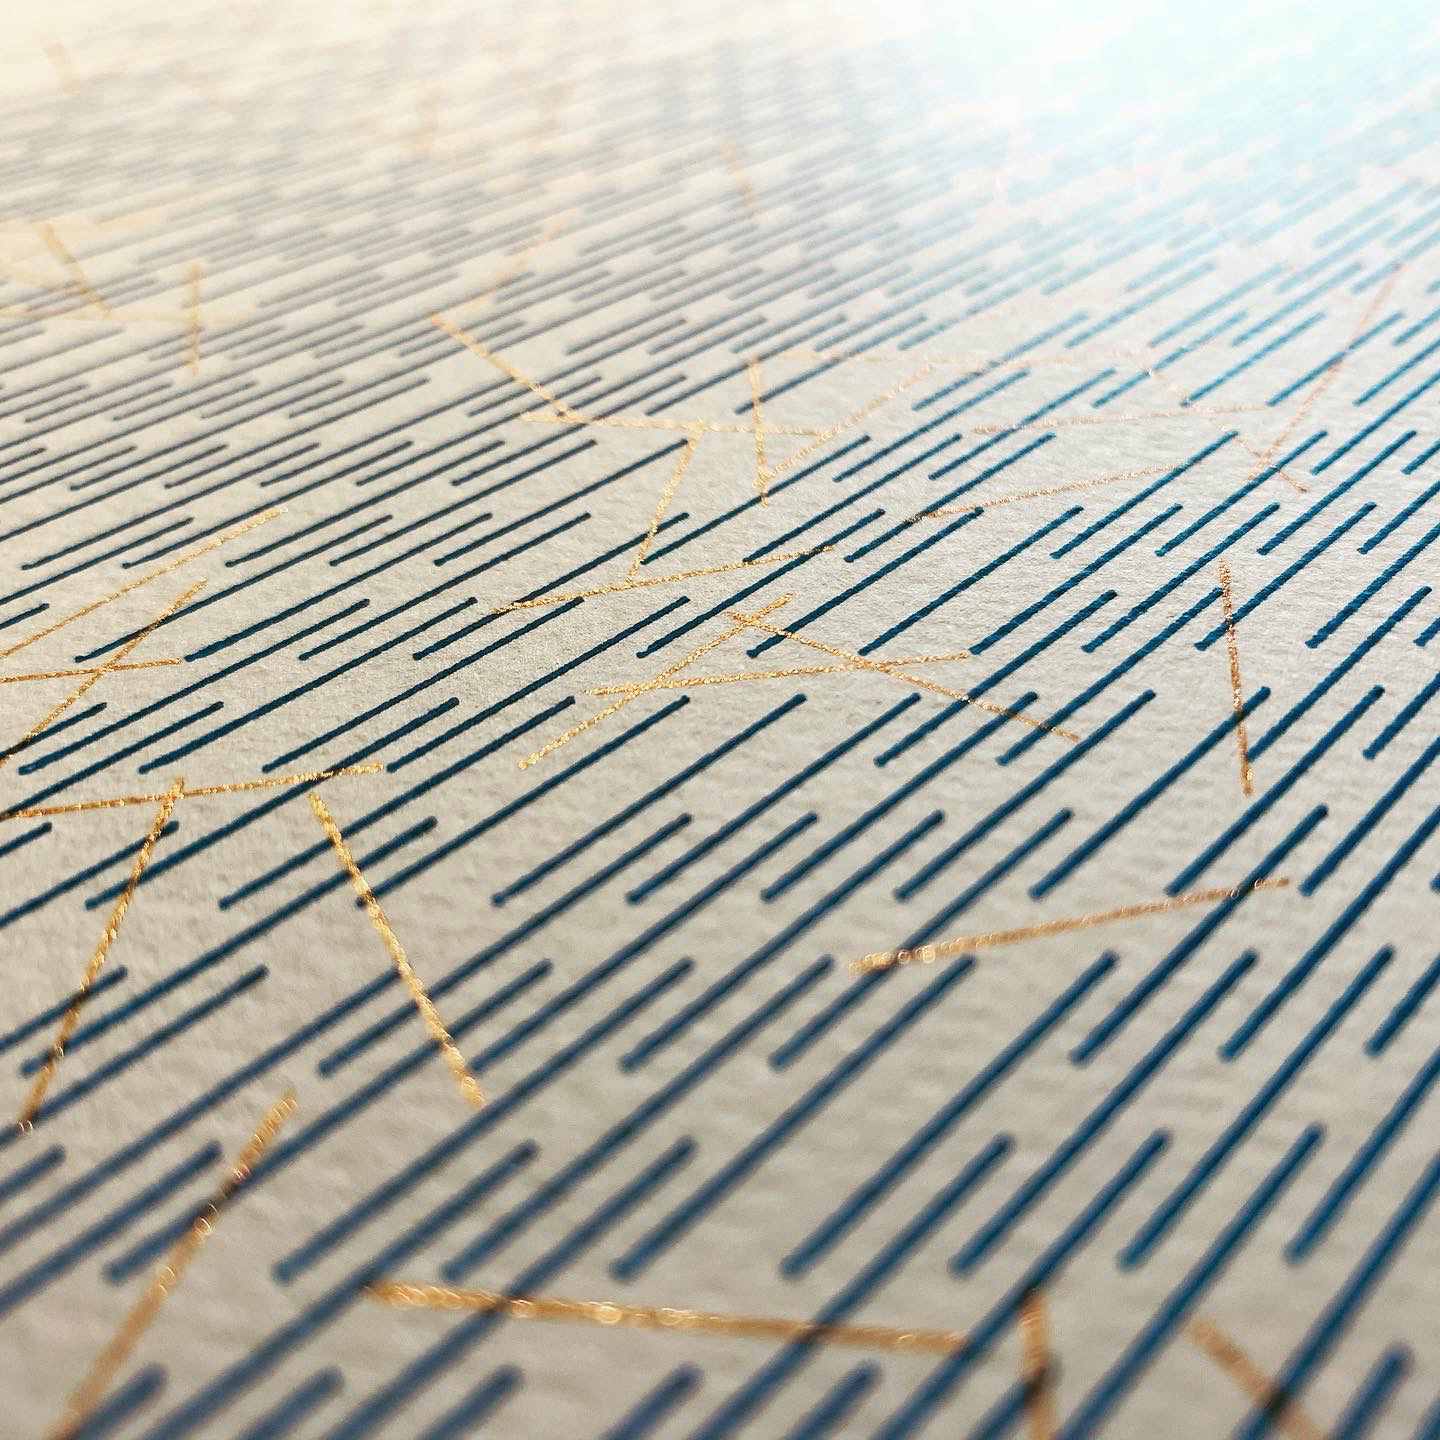
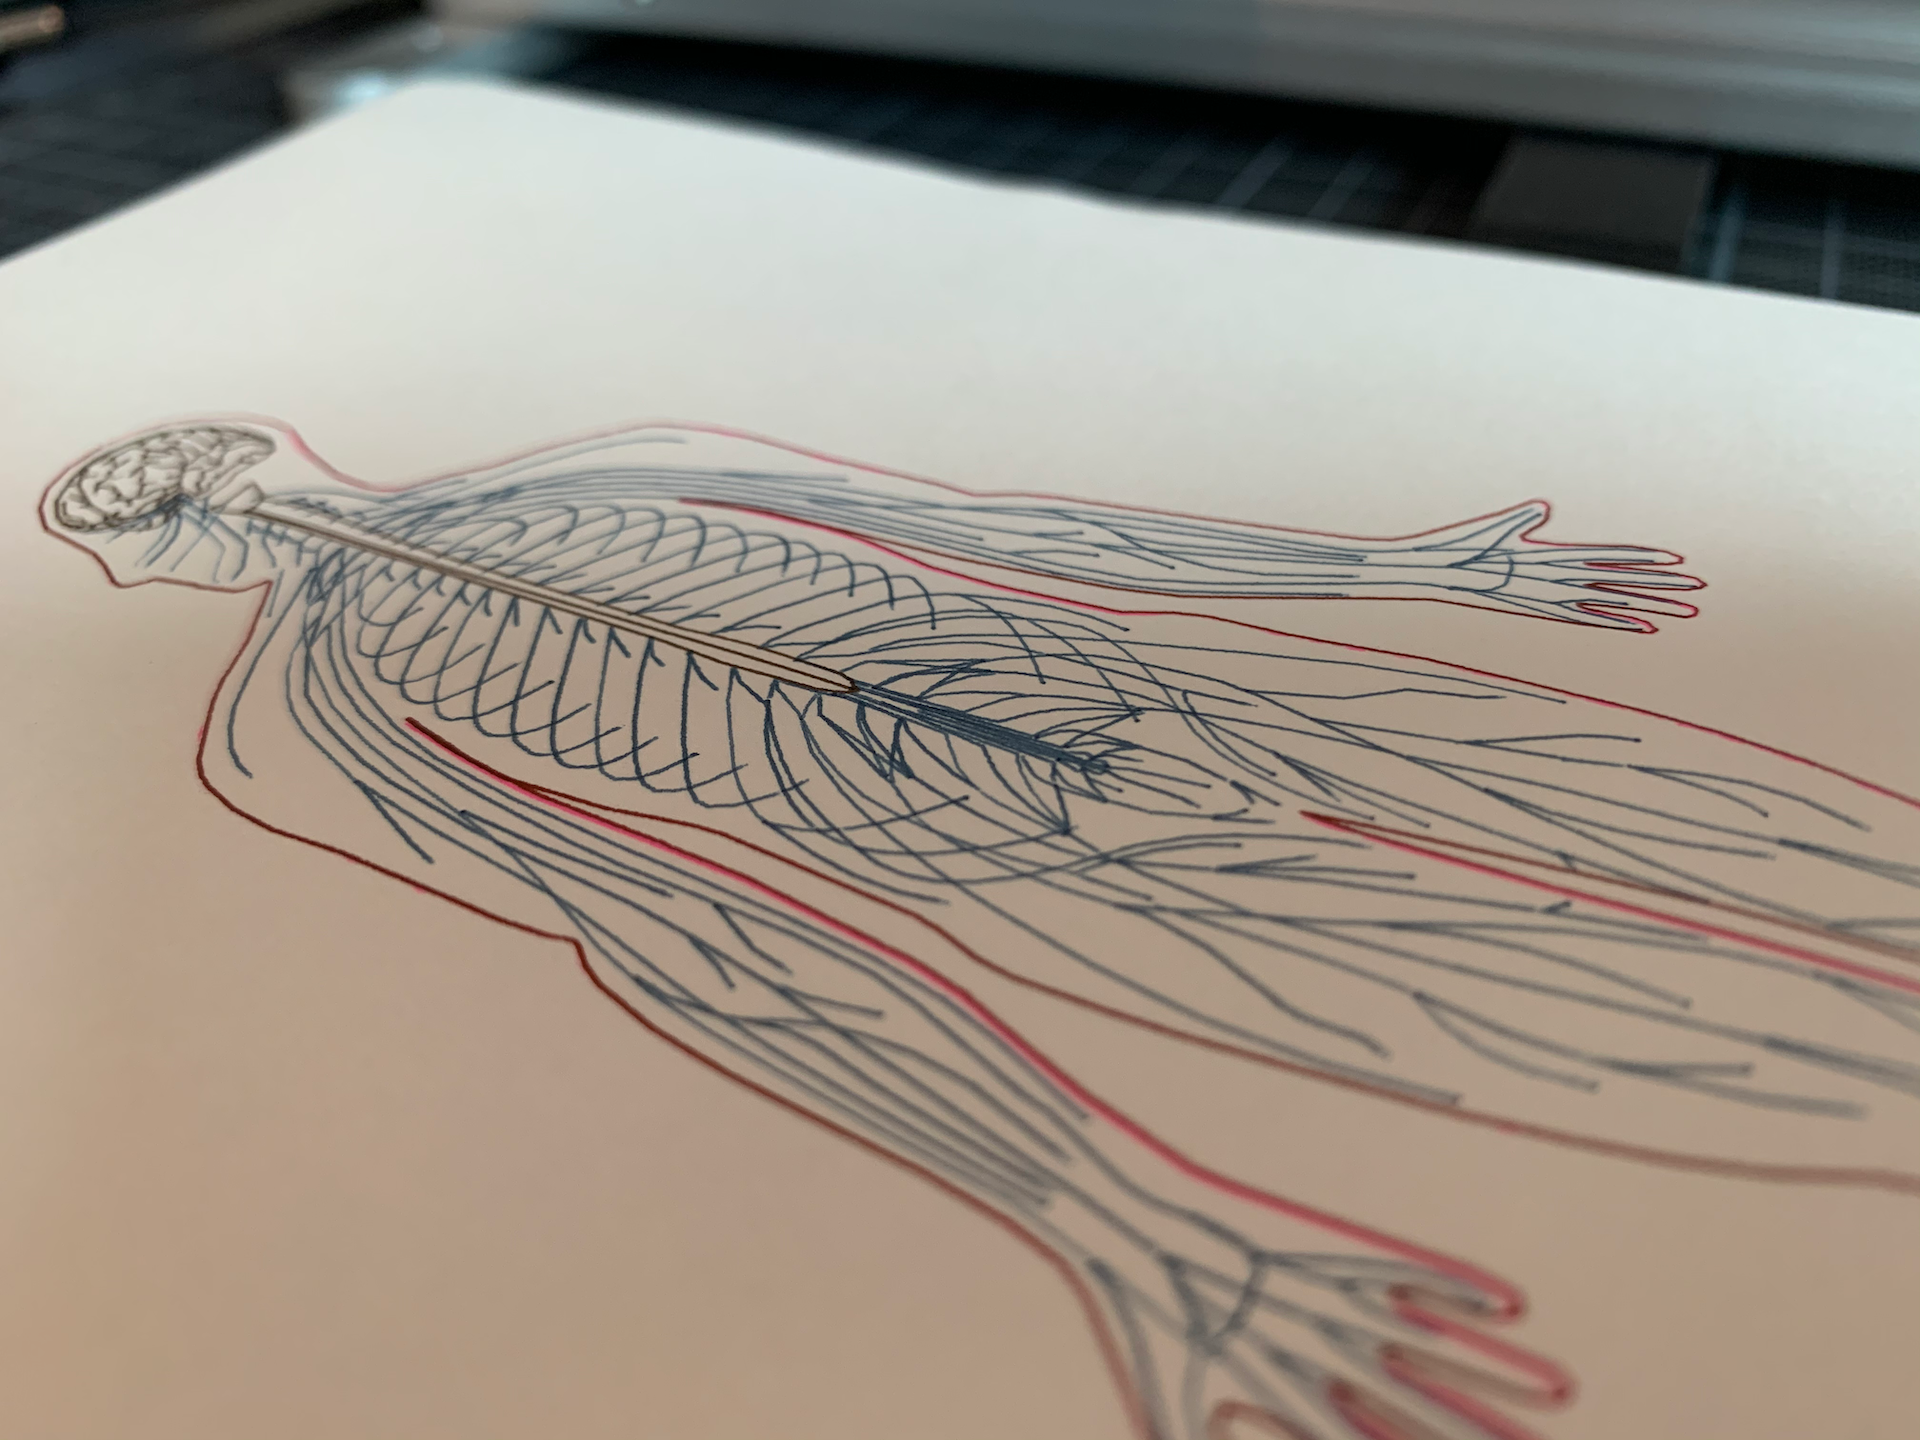
One of the first major coordinated projects that I worked on with the pen plotter was a set of generative postcards that I sent to subscribers of my newsletter all over the world.
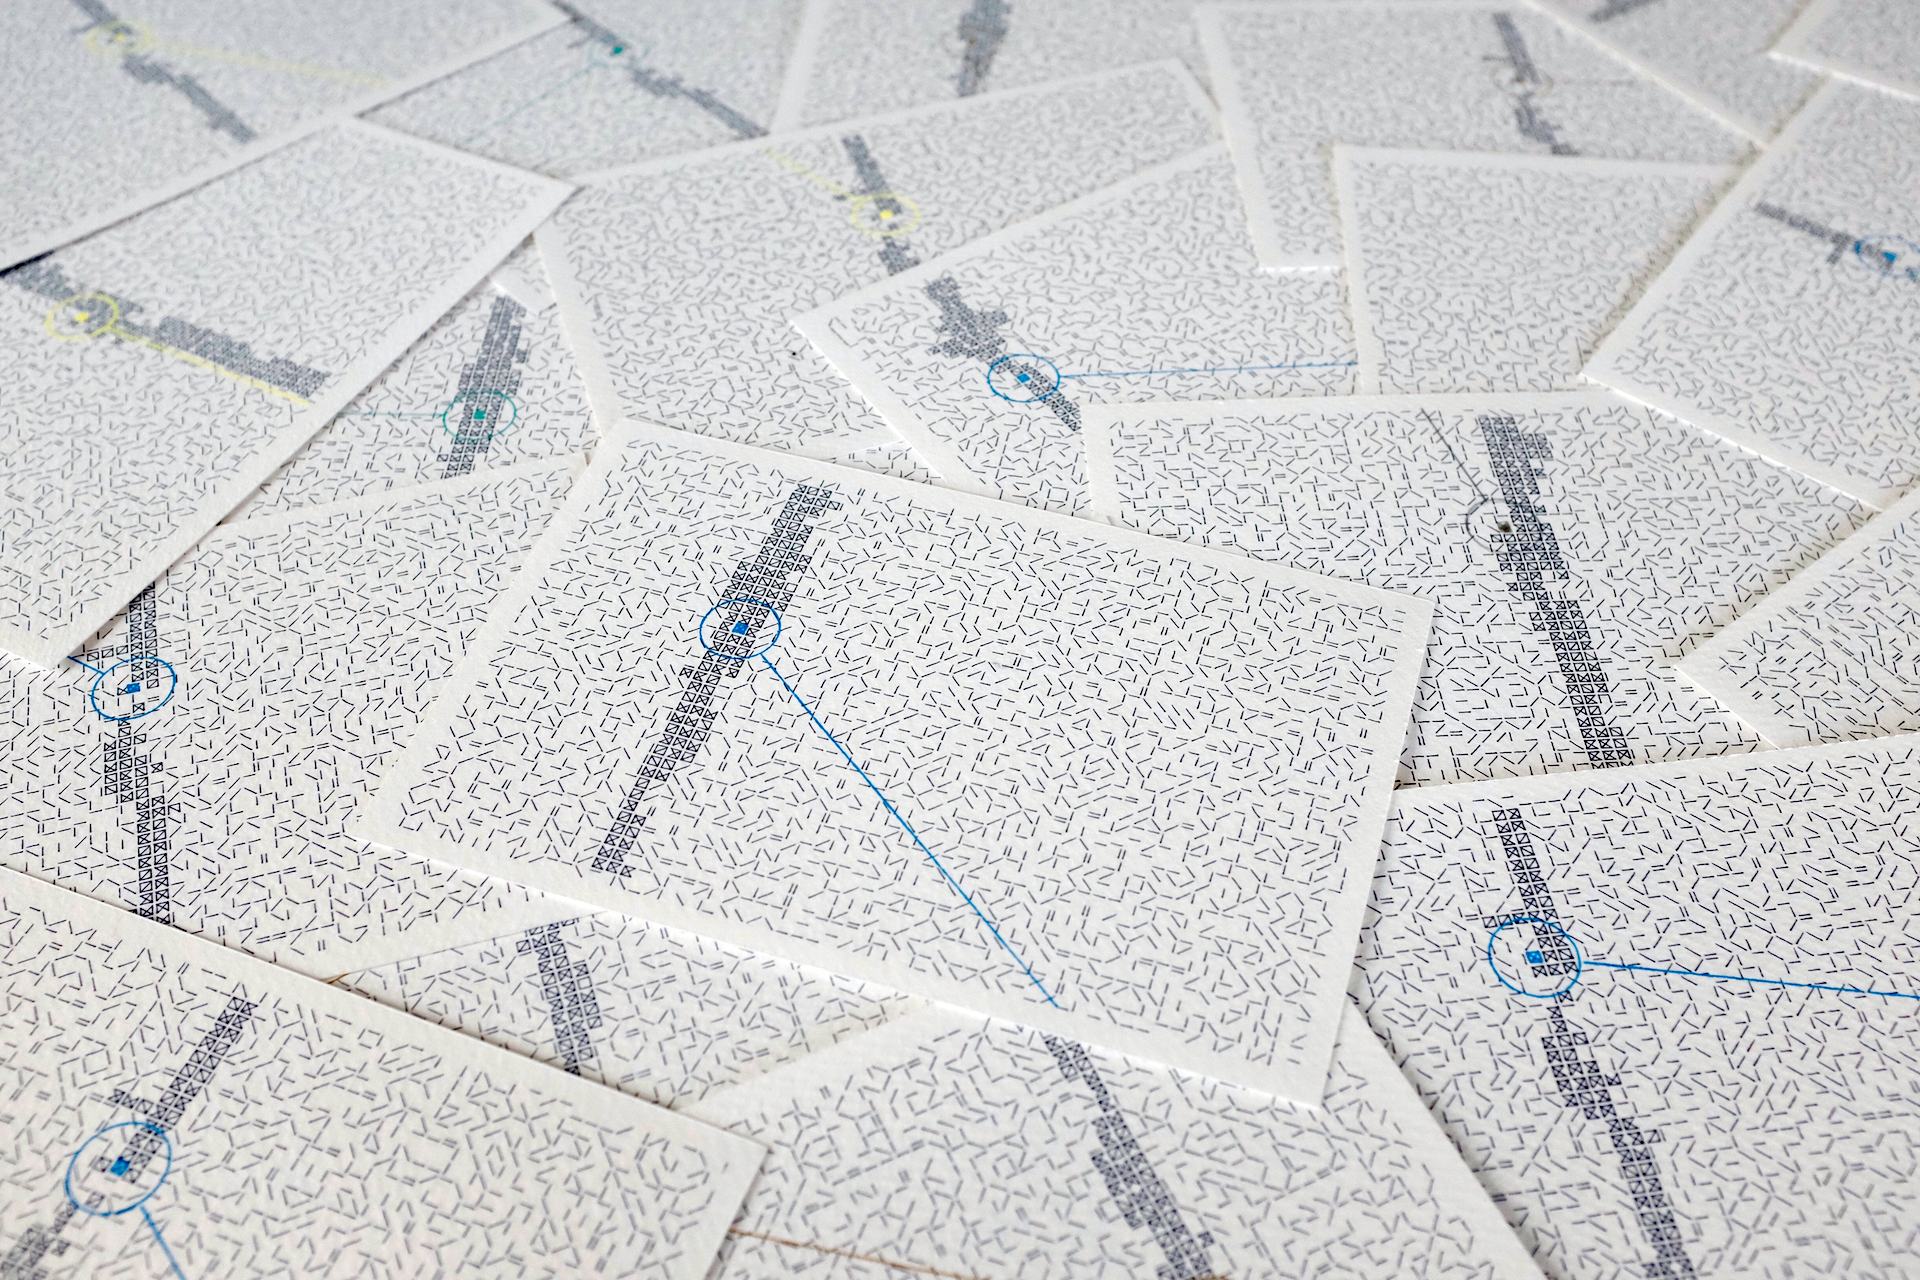
The postcards were all unique, their design generated by the address of the recipient and their answer to questions about their favourite kind of weather and time of day. From these foundations, I built up an image. At the time I didn't explain the encodings (leaving their interpretation as a challenge for the recipient) but I subsequently published a blog post that explains all.
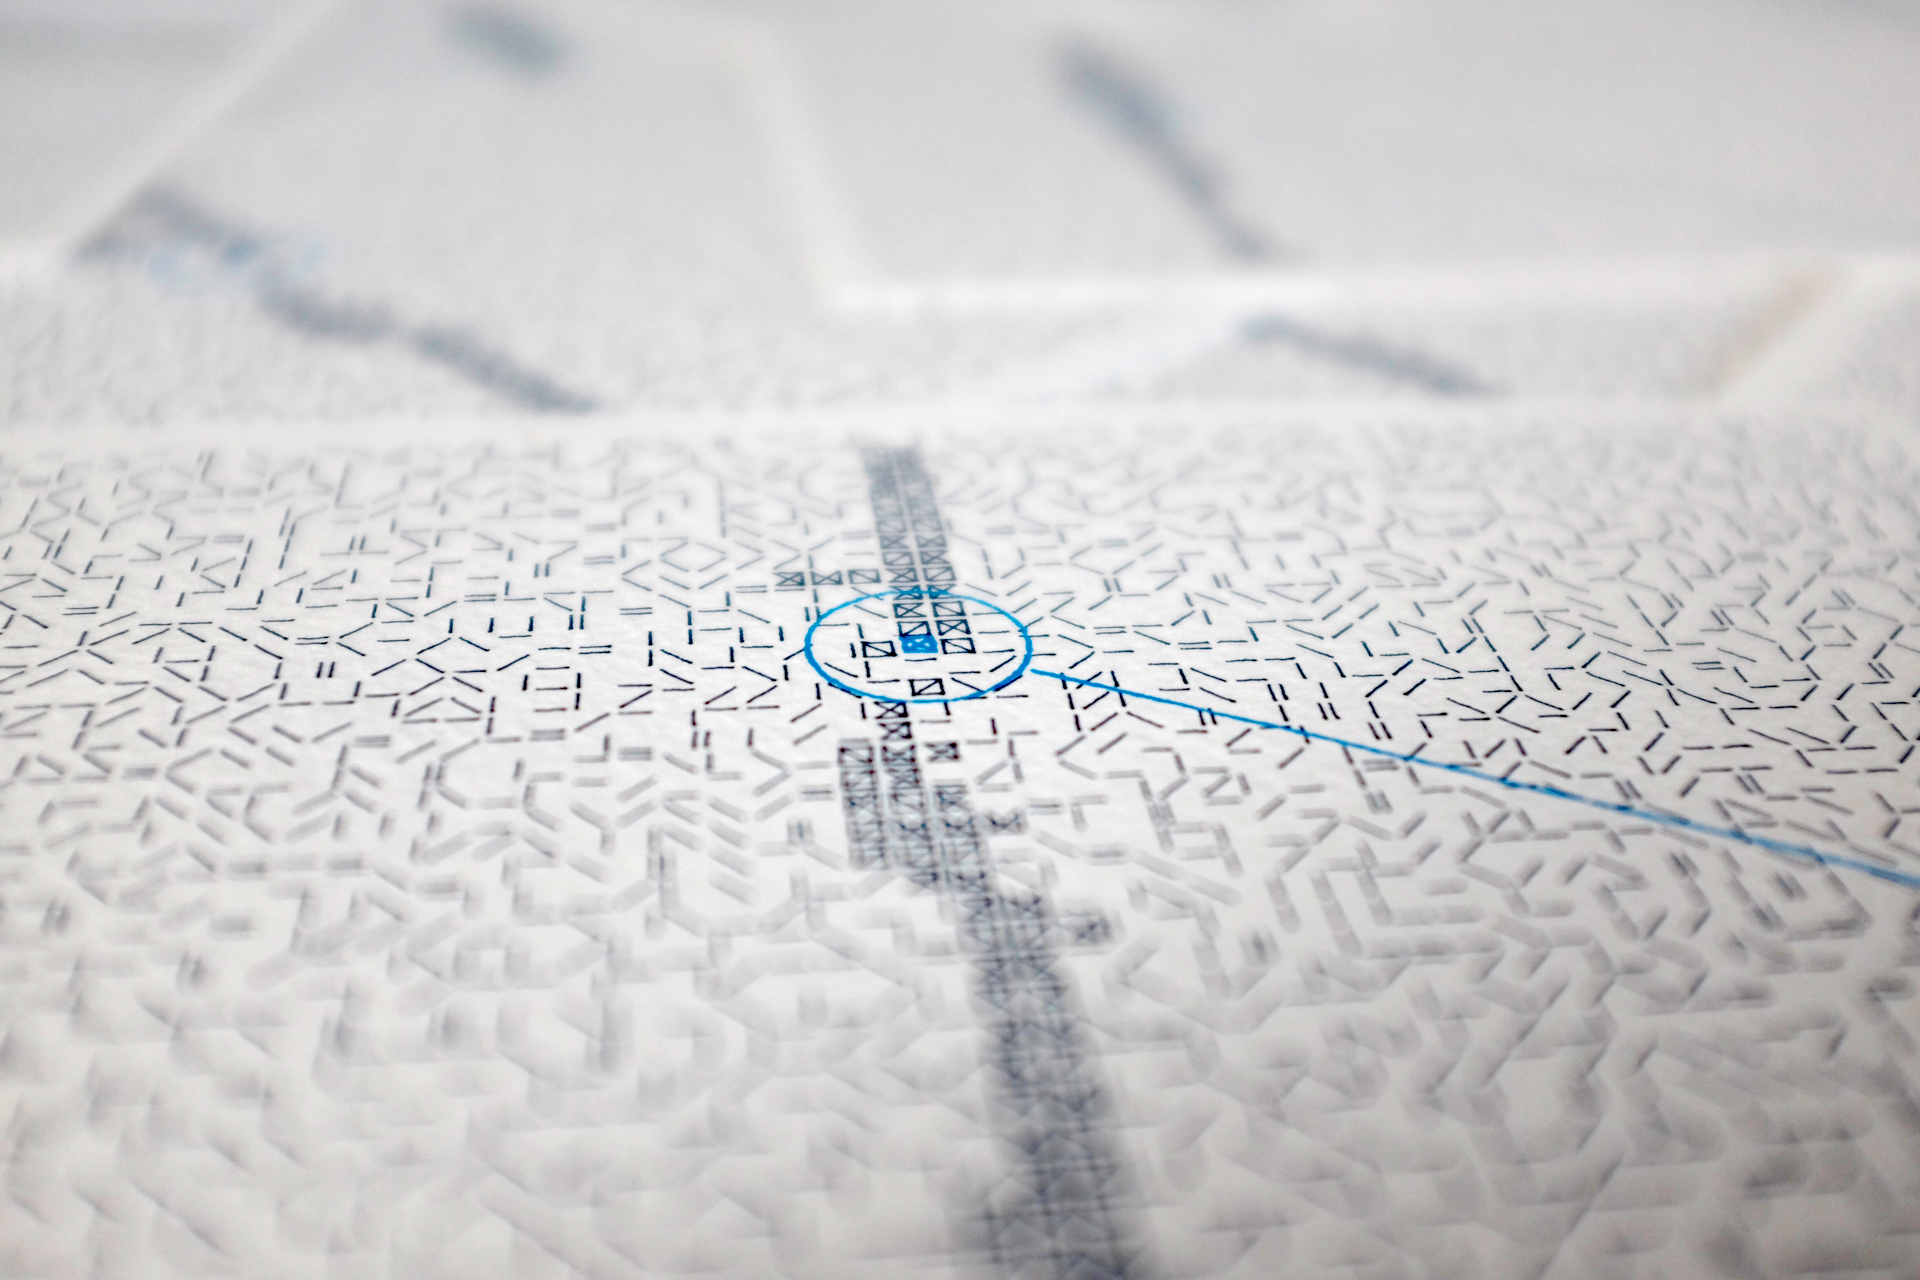
This was a lovely project, because I got to send something physical to people who I'd only previously interacted with digitally. I very much want to do something similar again some time, so if you want to receive one then make sure you're signed up for my newsletter and that you don't miss the call for addresses in a future issue.
Early in the year, before Covid became a thing in Europe, I visited Gothenburg's City Museum. Inside, I found a display featuring ideal cities designed by various architects over the centuries which caught my eye as I've long been interested in utopian architecture. I took a few photos with the intention to do something with them later.
A few weeks later I used Figma, my favourite vector design software, to replicate one of my favourites - the Renaissance ideal city of Sforzinda. Then in April, I exported an SVG version to draw on my plotter. I was extremely pleased with the results - I plotted it black on gold, and it looked stunning. Plus, using the plotter to draw architecture calls back to their original usage in the 70s as tools for draughtspeople.

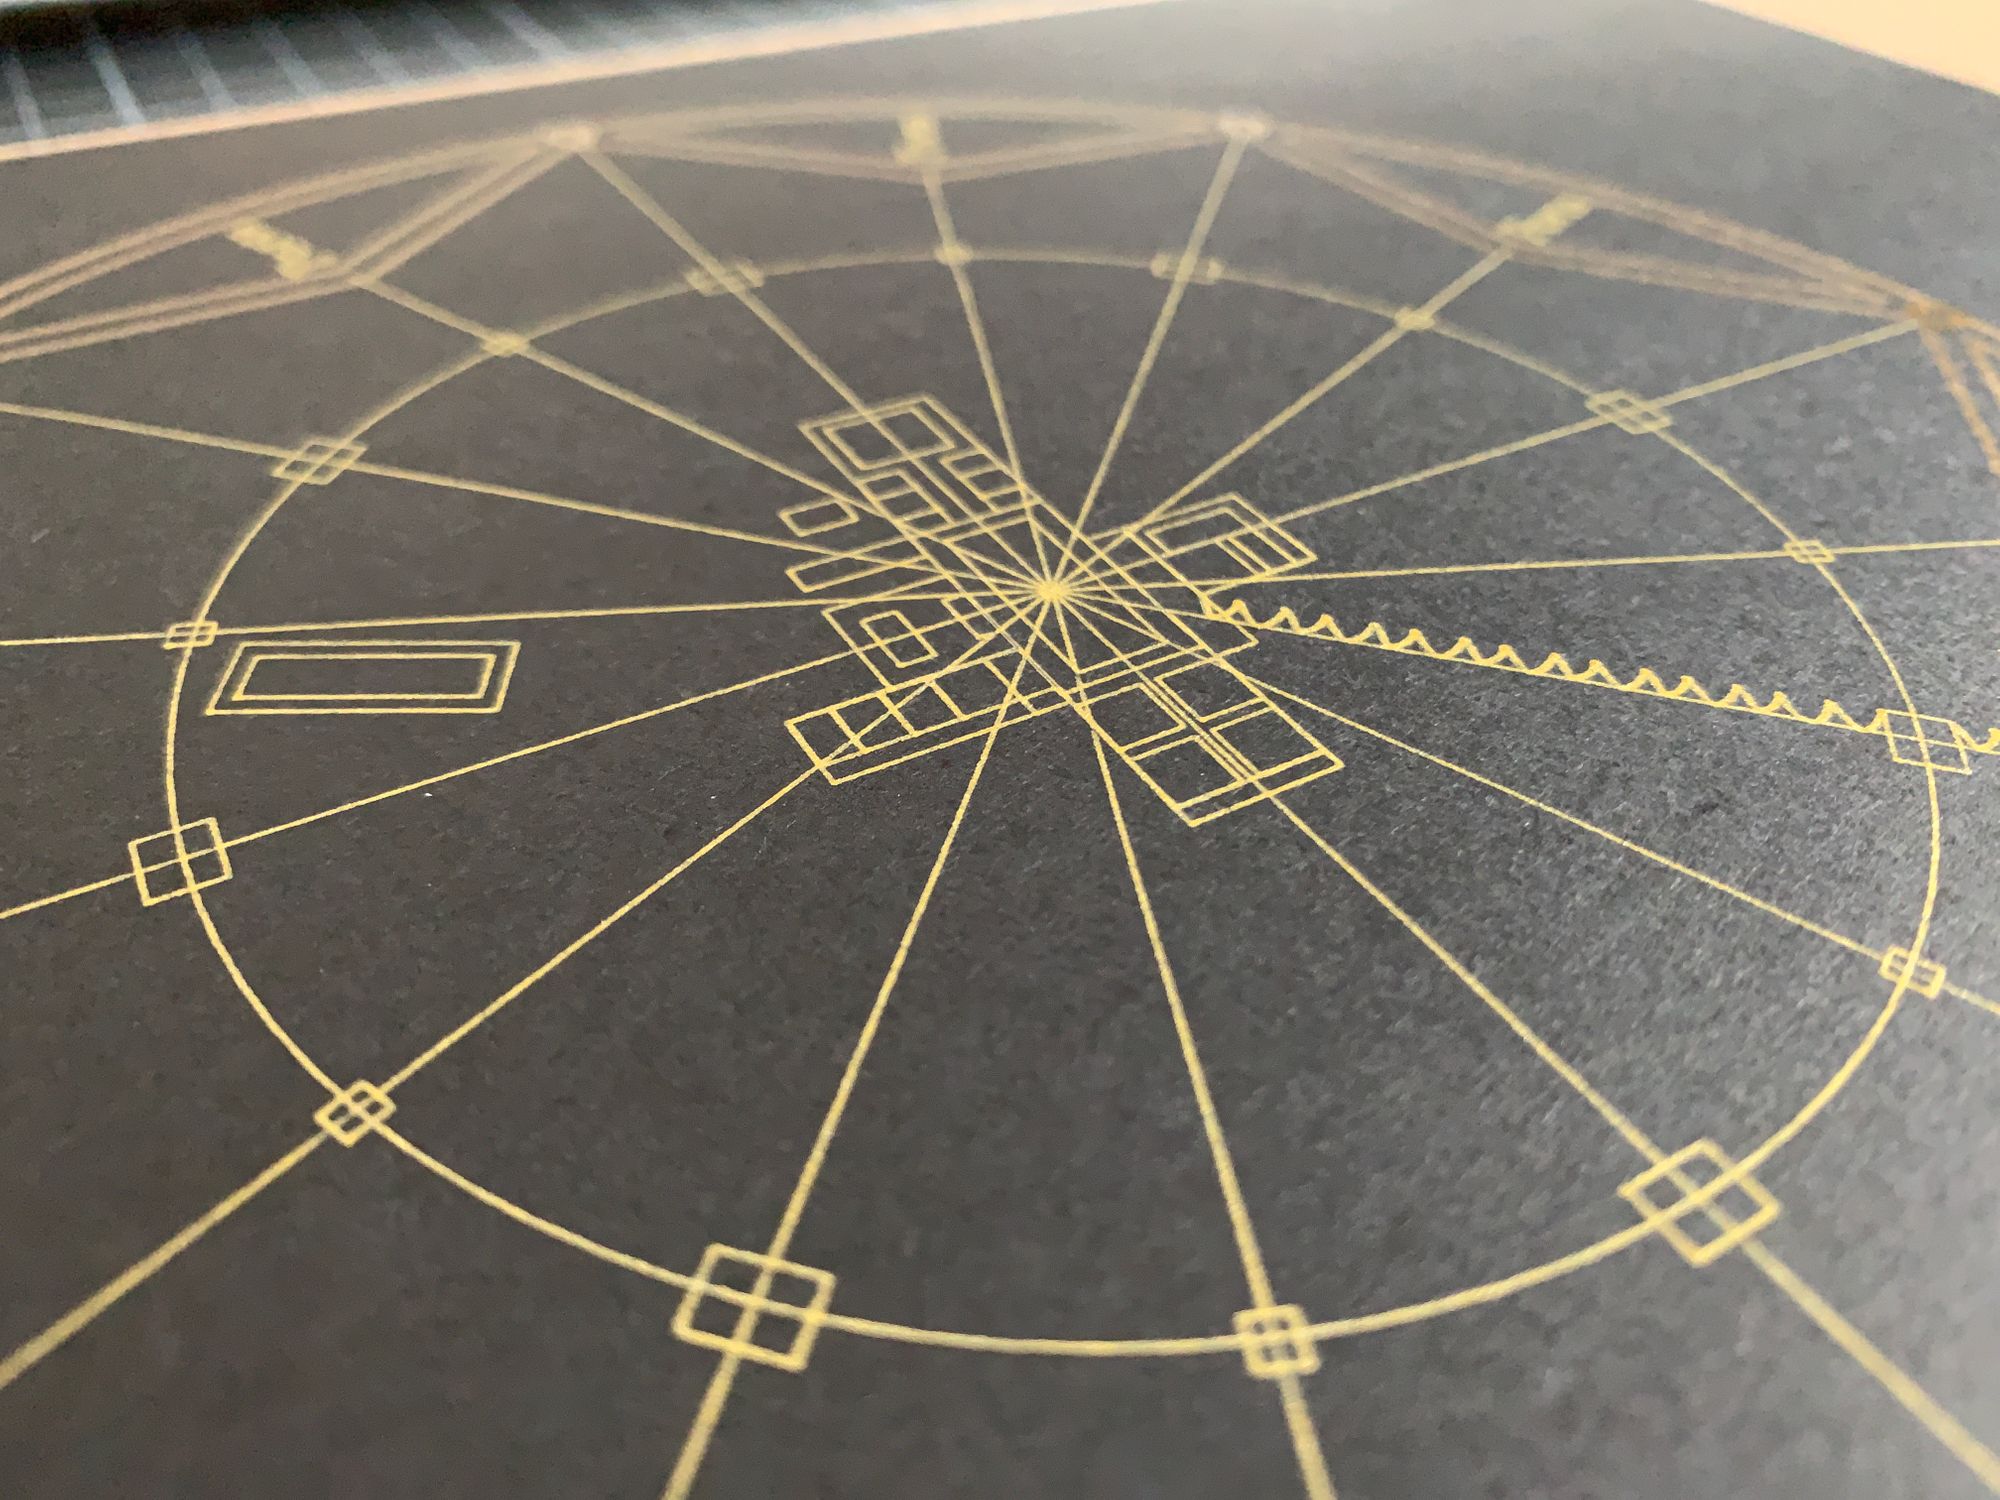
Then, in July, a local cafe put out a call for artists to exhibit their work. I signed up, without being totally sure what I wanted to exhibit, and over the next couple of months I developed a series of generative, plotted, utopian cities through time.

As well as Sforzinda, from the Renaissance, I included a piece influenced by Plato's Atlantis, one influenced by the modern "Fused Grid", and one that imagined what people of the future might wish for in a utopia of their own. The exhibition opened in September, and I wrote it up in great detail in a post on my blog.
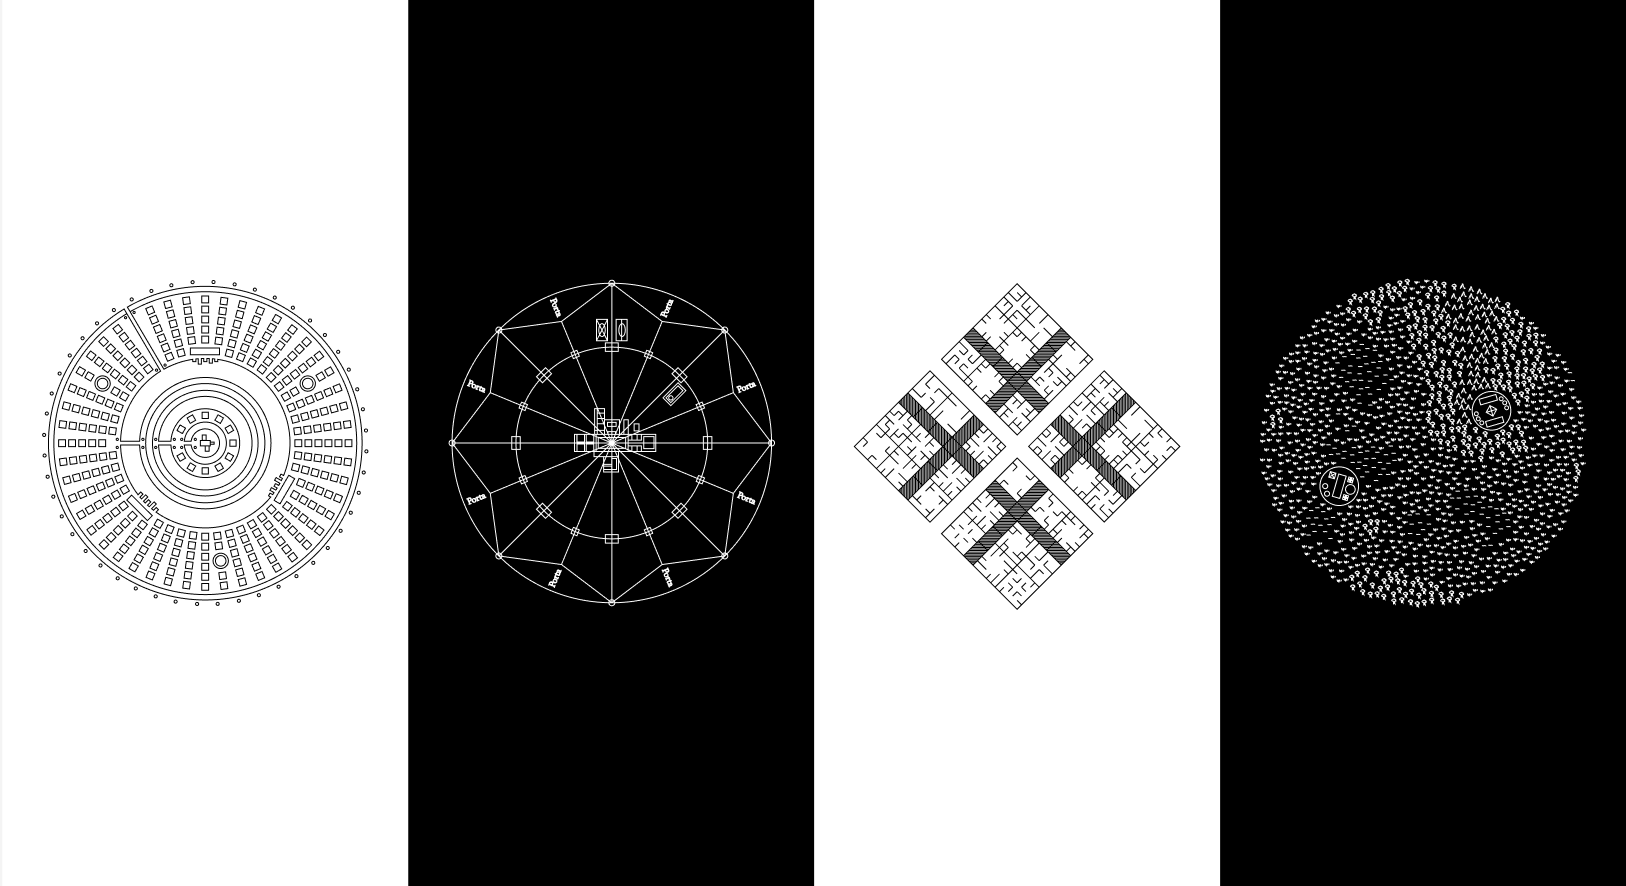
There are a few pieces left over from the exhibition which you can pick up on the cafe's website. I'm really proud of these one-off creations, so if you're looking for a last-minute gift for your favourite utopian dreamer, then take a look. I don't have any plans to sell my artwork on a regular basis, so if you want one then this is the best way to get it.
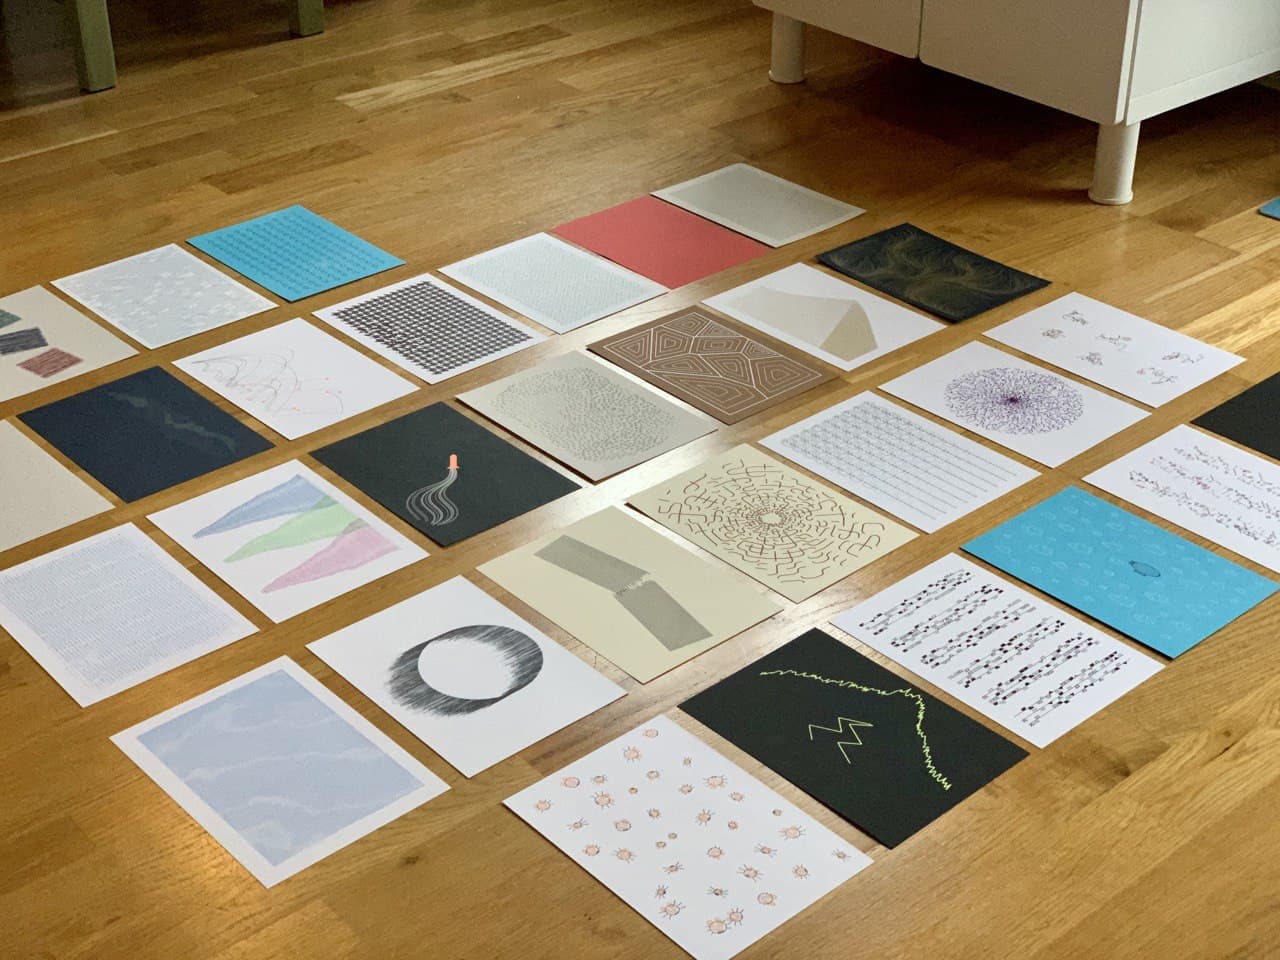
The last big generative art project I embarked upon in 2020 was Inktober. If you're unfamiliar, then Inktober is an annual celebration of drawing with ink. In my case, I put that ink in the claw of my pen plotter, creating a series of 31 generative artworks - one a day for the month of October.

An important component of Inktober is sharing your work with others, so I posted each image to my blog, Twitter and Instagram, as well as links to the source code and a generator that lets you create your own random versions of each piece.
After the month was over, I wrote a round-up blog post about the techniques, tools and processes that I used to code a fresh piece of artwork every day for 31 days straight. If you're interested in creating generative art yourself, then you're going to want to read this because it has loads of useful tips and advice.
One of my goals for 2020 was to speak at some data-oriented events, and I achieved that in December in the context of data art with a workshop at Datafest Tbilisi. It was about creating data art with p5.js.
I've not given a workshop before, and I certainly haven't given one digitally, so I put a lot of effort into writing, preparing and practicing it. I was still making edits to the script on the morning of the event. In the end, though, it went really well. It was aimed at beginners, and I got lots of great feedback that it was easy to follow and people were proud of their creations.
Replicating the masterpiece of data visualization by Ed Hawkins in #p5js with @duncangeere at @DataFestTbilisi ! Thank you 🌟 pic.twitter.com/ej7AeExYcz
— akomissaroff (@anakomissarof) December 16, 2020
I plan to make a recording of the workshop available in due course, so if you're interested in exploring data art through code then stay tuned for more information on how to get your hands on that.
Finally, in late November, I dipped a toe into a new medium that I hope to explore much more in 2021. Early Winter is a piece of generative music that I coded from scratch in Sonic Pi - the software that I'm also using to create Loud Numbers.
Next year, I want to get a lot deeper into this - creating generative soundtracks that fit alongside my plotter work. They might be sonifications of some of the internal data from the work, or they might be simply inspired by them. I'm not sure yet. But I do have criteria for success - which is that the musical work creates a mood and sense of place that enhances the enjoyment of the visuals. Let's see how that goes.
That's all for my roundup of my generative art practice in 2020. If you missed the roundup I wrote about my information design work, then you might like to read that too. There's one final instalment in this series of round-ups - some reflections on the immensely rewarding work that I did this year in building communities.
